Showing posts with label grid costs. Show all posts

Thursday, July 5, 2018

The Game of Peaks

Weapons used as props in the Game of Thrones
Wikimedia
By Benjamin Skinstad [CC BY 3.0 ]
The Game of Peaks

Cutting back on electricity use on the hottest day of  the summer is not a moral imperative. It is merely part of The Game of Peaks. This game allows large utilities to shift costs to smaller utilities and co-operatives.

Luckily Game of Peaks is all about accountants, not swords.  The Game of Peaks is nowhere near as brutal as the Game of Thrones. Nobody gets killed in the Game of Peaks, but lots of people get misled about the situation on the grid.  And lots of people end up paying more than their fair share of grid costs.  There are losers in the Game of Peaks.  You may be one of them.

Rules for the Game of Peaks

ISO-NE must charge utilities their "fair share" of system costs, particularly transmission costs. But what is their fair share?  ISO determines a utility's share of the grid-wide transmission costs by determining the power used by that utility during the peak-usage hour on the grid.  The percentage of power used during the peak is the percentage of transmission costs that the utility has to pay.

Of course, this percentage calculation is an opportunity for utilities to shift costs elsewhere. Utilities campaign about "shaving the peak." Announcements state that "we saved hundreds of thousands of dollars by shaving the peak."  For example, in this Burlington Free Press article from 2016, Green Mountain Power claims to have used batteries to reduce its peak power demand, saving customers $200,000 in an hour.

Conservation Now?

The statement about saving $200,000 in an hour is a bit misleading.  It looks like it is about energy conservation, sparing the grid, etc.  It isn't.

That $200,000 wasn't some excess cost of electricity in that single  hour.  The savings comes from the fact that Green Mountain Power used its predictive power and its batteries to reduce its demand at the time of peak demand.  Therefore, it will  reduce the amount it pays for grid-level transmission. Somebody is still paying that $200K for transmission: the overall cost of grid transmission hasn't changed. Some other utility is paying that cost.

According to an article yesterday in Electrek, Green Mountain Power has now has 5,000 kWh of battery storage at this time.  This 5 MWh of storage will not make much difference to expense of transmission on the grid. However, Green Mountain Power hopes it will make a major difference to their own bottom line, as it did in 2016.

Saving Electricity in Summer: The Game as Played

As I wrote in an earlier post, The Not-Stressed Grid in Summer, "beating the peak" is not about
  • saving money while the grid power is expensive, (it is not that expensive in summer) or
  • diminishing pollution (coal and oil are not in use much during the summer), or
  • keeping the grid from failing (there's plenty of reserve capacity). 

 The local grid is doing well in very hot weather.

I am writing this post because utilities only seem to talk about the grid when they are pushing "beat the peak." If the peak is beaten, the peak-beating utilities save money, and the other utilities have to pay more.  It's a zero-sum game, not a moral imperative.

Unfortunately,  people know very little about the grid, except that you "shouldn't" (whatever that means) use as much electricity on a hot day in summer.  If I write about the grid, I need to debunk that fallacy.  I feel that if I am going to write about the problems the local grid faces in winter, I also needed to write about the problems of summer. Or rather, about the non-problems of summer, and the misleading rhetoric of some utilities.

Yes.  Saving electricity is always good

Don't get me wrong. Being thrifty and not using excess power is always a very good thing.  Still,  it helps the environment more if you are thrifty with electric usage in winter (with all that oil and coal-burning) than in midsummer.  It helps your local utility's bottom line more if you are thrifty with electric use in summer.

My voice is rather muted,  compared to utility advertising campaigns, but I felt that I must speak up.


The Not-Stressed Grid in Summer

The grid is not stressed

The Northeast is using a lot of power, but the grid is not particularly stressed.  "Using a lot of power" and "stressed grid" are not the same thing.  Many local utilities are urging conservation...but this is not because the grid is stressed.  More about conservation in the next post.

How can I say the grid is not stressed? We're having a major heat wave! For days, Vermont temperatures have been in the high nineties. A number of communities opened "Cooling Stations" in public building such as fire departments. People were encouraged to go to air-conditioned malls, drink water, check in on elderly people who may need assistance, etc.

Okay, it's hot.  But I will start by comparing the grid situation on this heat wave with the grid  situation in the cold snap in December-January.

Hot weather electricity use and prices

Let's look at the ISO-NE electricity usage  chart for July 3.  The peak is near 25,000 MW. The LMP (local marginal price) prices for electricity were between about $25 and $80 per MWh, or about 3 cents to 8 cents per kWh.

Cold weather electricity use and prices

In contrast, during the cold snap at the beginning of this year, electricity use never got much higher than 22,000 MW, as shown in this graph from the ISO report on cold weather operations.

However, in  the cold snap, the LMP prices spent a lot of time between $150 and $300 per MWh (15 cents to 30 cents per kWh). The circled area on the graph below, from the same ISO report.


In short, during the cold snap we used less electricity and paid higher prices than we do now.

Conservation and fuel usage

Using more electricity in New England means making more carbon dioxide and burning more fossil fuels.  So conservation is always good. But is conservation in summer particularly wonderful? Not really.

Right now, we have a fairly clean grid. The fuel mix is mostly natural gas, nuclear,  hydro and renewables.  The grid was running 60% gas, 20% nuclear 16% hydro and renewables.  Pretty good, in terms of emissions!  Here's a recent fuel mix graph.


A fuel mix chart for the grid on July 4


In contrast, in the winter, when natural gas was not available, oil and coal were in heavy use (Oil Kept the Power Grid Running op-ed). During the cold snap, the mix was 30% oil, not "less than 1%" oil, as it is now.  Coal use was higher, also, up around 5%. 

Surplus Capacity

So far, there's no particular reason to conserve right now instead of conserving some other time.  But let's look at something else.  Perhaps, even with natural gas available, the grid is close to maximum capacity in hot weather? Perhaps, if we don't conserve, the grid will fail?

Nope. The grid is doing well.  If you look at the ISO-NE website,  it lists "surplus capacity" right on the front page.  At this moment, as I am writing this, on a very hot day, surplus capacity on the grid is 1,180 MW.  That is the capacity available above the maximum predicted peak power use for today (23, 000MW) and above the grid's operating reserve requirement for today (2,492 MW). You can always check these types of figures in the ISO-NE morning report

Or, you can simply remember that when ISO-NE predicted the possibility of rolling blackouts in the future, ISO was concerned with winter stress on the grid leading to blackouts. They were not concerned with high summer electricity usage. 

 In short, conserving electricity this summer doesn't save more money or more carbon dioxide then it would save at many other times. As a matter of fact, it saves less of both than it would save in a winter cold snap.  Conserving now also doesn't "save the grid" from blackouts.  The grid is operating at high capacity, but nowhere near its capacity limits.

 So why are the utilities pushing conservation right now?

Game of Peaks

The utilities are urging conservation right now because they are playing the Game of Peaks.  It's  a utility game about money. If they play the Game of Peaks well, they can shift some costs from themselves over to neighboring utilities.  Yeah, it's a zero-sum game.  ("I win" can only happen if "you lose.")

 Learn the rules for the Game of Peaks in the next post.

Saturday, January 27, 2018

The Northeast Grid and the Oil

ISO-NE Report on Cold Weather Grid Performance

It was dramatically cold here in the Northeast from late December through January 8.  Temperatures of ten below were common. The grid used amazing (30% or more) amounts of oil, as the power plants could not get gas. (I wrote a couple of blog posts about this, which I reference at the end of this post.)

On January 16, ISO-NE issued a report on the grid behavior during this period. Cold Weather Operations, December 24, 2017 through  January 8, 2018.  This document is worth reading.   Frankly, in my blog posts, I simply did not know how bad things were becoming on the grid. Let me quote viewgraph 11 of the ISO report:
"As gas became uneconomic, the entire season’s oil supply rapidly depleted"

Pictures speak louder than words

This is a story best told in graphics.

As I noted earlier, the generation mix on the grid shifted heavily to oil. On December 24, 2017, oil supplied 2% of grid electricity. On January 6, 2018, oil provided 36% of the electricity. ISO slide 14 shows this very effectively.

Slide 14
from ISO report
Double click to expand
Other illustrations are from the same report

Update:  Ed Pheil pointed something out to me: if I don't explain that demand on the grid was rising between 12/24 and 1/1/, the decline in nuclear's share of the grid electricity (from 39% to 27% etc.) is inexplicable.  Did the nuclear plants go off-line?  No. But there are only so many nuclear plants, and they can make only so much power.

The chart below shows a steady line of "daily generation" for the nuclear plants.  It is the green line near the top of the chart. There's one exception: Pilgrim went off line when a transmission line failed.   You can see the dip.

Thank you to Ed.  This was a necessary clarification.

Slide 13


Local natural gas prices soared, while Marcellus shale prices remained fairly steady.  Electricity prices followed the natural gas prices. However, generators that could switch to oil did the switch. Oil was was less expensive. Natural gas prices rose about 30 fold (from around $3 to around $90, as shown below)

Slide 30


Due to power plants using lower-priced oil, however, prices on the grid rose from around $50 to around to $450/MWh, only a ten-fold rise.

Slide 55
Oil Depletion

The region was burning oil far faster than it was replenishing it.  On December 1, we had 68% (of the maximum oil) available to power plants.   On January 8, we had 19%.

Slide 21
For a more dramatic picture, ISO shows a single power plant's oil supply, which went from an eight-day supply to a one-day supply over the same period.
Slide 22
There are many important slides.  For example, slide 17 shows how the generators that were enrolled in the ISO-NE Winter Reliability Program really picked up the slack, and slide 18 compares the amount of oil burned in the two weeks of cold with the amount of oil burned the previous two years.  (More was burned in the two weeks of cold.)  

And then there was all the scrambling to keep things going. Slides 35 and 36 show that there were emergency conference calls about the grid---pretty much every day.  

What have we learned?

Much as I dislike burning oil for power, I dislike widespread outages even more.  I give ISO-NE tremendous credit for the Winter Reliability Program, and for keeping the lights on.

According to the last slide in the ISO program, replenishment of oil is the key issue for reliable operation during cold weather in New England.  ISO-NE is correct,  according to their charter.

slide 62


However, the ISO-NE charter is limited.  For me, the important thing is to keep Northeastern nuclear plants operating. Nuclear plants are thoroughly reliable.  (Yes, Pilgrim went offline due to a transmission line failure.) Nuclear plants keep making electricity, no matter what the weather might be, as long as there is a transmission line to send out their power. 

In cold weather, we need reliability. In cold weather, we need nuclear. 


----

Earlier blog posts:

Friday, December 29, 2017

More Cold and More Oil on the New England Grid

Oil Use Increases

Once again, I will tell this blog in a series of pictures.

In my blog of December 27, I showed a snapshot of the New England grid in the early evening.  The temperature at my location was 7 degrees, the local marginal prices (LMP) on the grid were running around $200 MWh (20 cents per kWh), oil was 22% of the fuel mix, renewables were 11% of the fuel mix (I remarked that this was on the high side for renewables) and the high renewable percentage was due to the wind energy.  Wind was 50% of the renewables.  The blog post was Successful encouragement of oil on the New England Grid.  The source of all the information (except the local weather) was the ISO-NE web page, ISOExpress.

That post was on December 27.  Yesterday, December 28, I noted that the percentage of oil had gone up above 30%, and the portion of renewables had gone down.  But I didn't write another blog post. My snapshot is below. (Double click on any graphic to enlarge it.)

December 28 fuel mix


Getting Colder, and Oil Use Stays High

Today, around 1 pm, the temperature was 1 degree, as show below. The weather had gotten colder.

1 p.m. December 29 temperature
The price of power on the grid had also gotten higher, around $300/ MWh (30 cents per kWh)

1 pm December 29 prices on the grid

Though I must admit that as I write this at 3 p.m, the price has fallen again to around $200/ MWh.  Also, note the color codes on the map.  The colors show the prices graphically.  Closer to red is higher priced.

Oil use has stayed high, from December 28 evening (above) to one pm December 29, (when I took a bunch of screen shots) to right now at 3 pm.  Oil has been between 30 and 32% of the grid.

December 29, oil is around 30% of grid power

Not as much wind on the grid

What about the renewables?  On December 27, a windy day, renewables were at 11% of the grid, and wind was 50% of renewables.  (See my December 27 post for the graphics on this.)

Today, at one pm, not so much wind.  It was actually snowing rather gently.  At that time, renewables were only 7% of the grid power, and wind was only 13% of renewables.

Renewable mix on the grid. Wind at 13%.
 What next?

I think oil use will remain high until the cold weather is over, about a week from now.   The wind may spring up again in the evenings, or it may not.  Whichever it chooses.  Nobody controls the wind.  So renewables may continue at 7% or go up to 11% again.

On the other hand, we haven't really hit peak demand yet.  Here's a screen shot that I just took. This is the ISO-NE estimate of system loads today, and the actual loads up until 3 p.m.
System loads, as forecast
As you can tell in this chart, around 18 hours (6pm) looks like peak demand.  Check in and see if the percentage of oil goes up even further.  I'm going to check.  I'm curious.

Here's the link for these real time updates from ISO-NE, ISO Express. https://www.iso-ne.com/isoexpress/

In conclusion

Isn't it nice that you can store oil on site?  Maybe someone will notice what Rickover noticed: you can store nuclear fuel even more easily than you can store oil!  I wouldn't hold my breath for people to notice this.  (/snark)

Meanwhile, I will check back at about the grid at 6 p.m. but I won't be posting. I leave the evening results as "an exercise to the reader."

Wednesday, December 27, 2017

Successful encouragement of oil on the New England Grid.

Cold in New England, and Going to Stay Cold

I decided to tell this blog as a series of pictures.  

I will start with a screen shot that I took of the weather report, at about 5:30 this evening. (Note that "Hartford" refers to the town of Hartford Vermont, where I live.)  It was 7 degrees F at that time, with a drop to minus 16 expected tonight.  The next few days are expected to have single digit high temperatures and minus temperatures of two digits (minus 10, etc)
Weather at 5:30 pm and forecast

So, how is the grid doing? Fairly well, actually.  At 5:30, I took this picture, showing that the LMP (local marginal prices) were running at about 20 cents a kWh. ($200 a MWh translates to 20 cents per kWh.) The graphics below are screen shots from ISO-NE. I took my snaps at 5:30 at this ISO page, which is updated every 5 minutes. https://www.iso-ne.com/isoexpress/

Grid prices and electricity use at 5:30 p.m. and throughout the day

As you can see by the retrospective graphs to the left of the map, prices have been up and down between $100 and $250  (10 cents and 25 cents per kWh) most of the day.

Oil on the Grid

During cold snaps, gas pipelines must supply homes first, and gas-fired power plants get short-changed.  ISO-NE has a Winter Reliability Program which mainly compensates gas-fired power plants for keeping fuel on site: oil or LNG or CNG. (Liquefied or compressed natural gas.) The grid was running about 22% oil at 5:30 this evening.

The current Winter Reliability program is described in an update presentation, given December 7,  2017  by Anne George of ISO-NE. On page 5, Ms. George describes the current winter reliability program, which pays oil and gas fired generators to have fuel on site.  (Page numbers are at the lower right of each viewgraph.) On page 18, she describes how the forward capacity auctions are attracting new generation, even as older plants retire.  Specifically, ISO-NE is attracting new dual-fired natural gas resources: gas turbines that can also burn oil, and therefore can store oil on-site for cold weather.

ISO-NE's attempt to provide winter electricity by encouraging oil use in cold weather is working.  The next picture shows (among other things) the fuel mix at 5:30 on the New England Grid. 

Fuel use at 5:30 p.m. and throughout the day
You can see that 25% of the electricity was supplied by nuclear, 24% by natural gas, 22% by oil, and 11% by renewables.  Usually, the grid runs closer to 50% natural gas and just a few percent oil. If you go to viewgraph 19 of the ISO-NE presentation,  you can see that natural gas is expected to be 55% of normal generation, and oil is the merest sliver on the graph.

The Renewables

In the chart above, renewables are making 11% of the power on the grid.  This is on the high side. (Viewgraph 19 of the ISO presentation shows renewables making 5%, for example.)  The high contribution of renewables is due to the wind.

In my experience of New England, really cold weather is often deathly still.  Not this time.  The wind is blowing, the windchill factor is serious, and the wind turbines are making considerable amounts of energy.  Wind turbines are making 50%  of the renewable power on the grid, as you can see in the chart below.  Basically, the other 50% of the renewable power is being made by burning wood and refuse. That power is pretty steady: the wind contribution goes up and down.

Since wind is making half the renewable power on the grid, and renewables are making 11% of the power on the grid, therefore,  the wind turbines are making 5.5% of the power on the grid. 

 The chart below shows the percentage of renewables on the grid at 5:30 p.m. 
Renewables on the grid at 5:30 p.m. 50% of the renewable power is from wind

The End of the Grid Tour

I am pleased that it is both cold and windy. (Actually, I am not that pleased about it. I have to live here, after all.)  I also know ISO must be fuel-neutral, so dual-fuel gas-fired generators are considered good. However, I can't help but think that using more oil in the winter is a step back for New England, not  a step forward.  

If you want, you can go to the ISO site, and watch the grid.  Or if you don't live in New England, look up your own grid, and do a compare-and-contrast. I would love it if you would comment on this article.

(An article from about four years ago in similar weather: The Cold Truth on the New England Grid.)


Wednesday, January 4, 2017

Pay for Performance on the U.S. Grid: No help to nuclear

Happy New Year to everyone, and especially to readers of this blog!  

 I plan some posts on nuclear power and grid policies.

This post shows how instituting  Pay for Performance does not help nuclear plants. The post is an expanded version of my article, Pay for Performance on the U.S. Grid, at Nuclear Engineering International, February 2016.   I am grateful to Nuclear Engineering International for permission to use their graphics.

No Help to Nuclear: Pay for Performance on the U.S. Grid

The United States electric system contains both traditional (vertically integrated) and “liberalized” markets.  In the “liberalized” markets, RTOs (Regional Transmission Organizations) and ISOs (Independent System Operators) operate the grid, using free-market auctions.  The RTO areas are the most challenging for the American nuclear fleet. All the nuclear power plants that are in danger of shutting for economic reasons are in RTO areas.
RTO Areas, from FERC

Neither RTOs nor vertical integration are perfect systems for pricing electricity. RTOs are relatively new (started in the 1990s) and are still evolving their policies.  In particular, some RTOs are planning to reward more-reliable plants by instituting “Pay for Performance,” starting in 2018.  Unfortunately, despite the hopeful name, this change is not likely to help nuclear plants.

The RTOs were designed to lower costs for consumers by giving them the benefit of free-market pricing: electricity is bought in an auction. When the ISO needs power, plants “bid in.” ISO chooses the lowest price power first, moving up the bids until all the power needs are met.   Power plants and utilities can also negotiate Power Purchase Agreements (PPAs) at mutually agreeable prices, and a great deal of electricity is sold in this manner. However, in many markets, investor-owned utilities are prohibited from entering into long term PPAs with conventional generation sources. At any event, PPA electricity prices tend to follow grid pricing, though sometimes with a major lag time.


The Missing Money

Actually, there are two auctions: the energy auction (electricity) and the capacity auction (power plant availability).  (See Sidebar below.)

Search for the Missing Money
James Bride, Energy Tariff Experts
Unfortunately for the energy auction theory, the real-time energy auction plan immediately ran into the first “missing money” problem.  Why should owners of higher-priced plants maintain their plants? Their plants are not guaranteed a price (while on the grid) nor are they guaranteed a number of hours that the grid is sure to call on them, and for which they will be paid.

It became clear that paying only for energy (kWh) might not provide enough money to maintain all the plants that are needed for reliable grid operation.

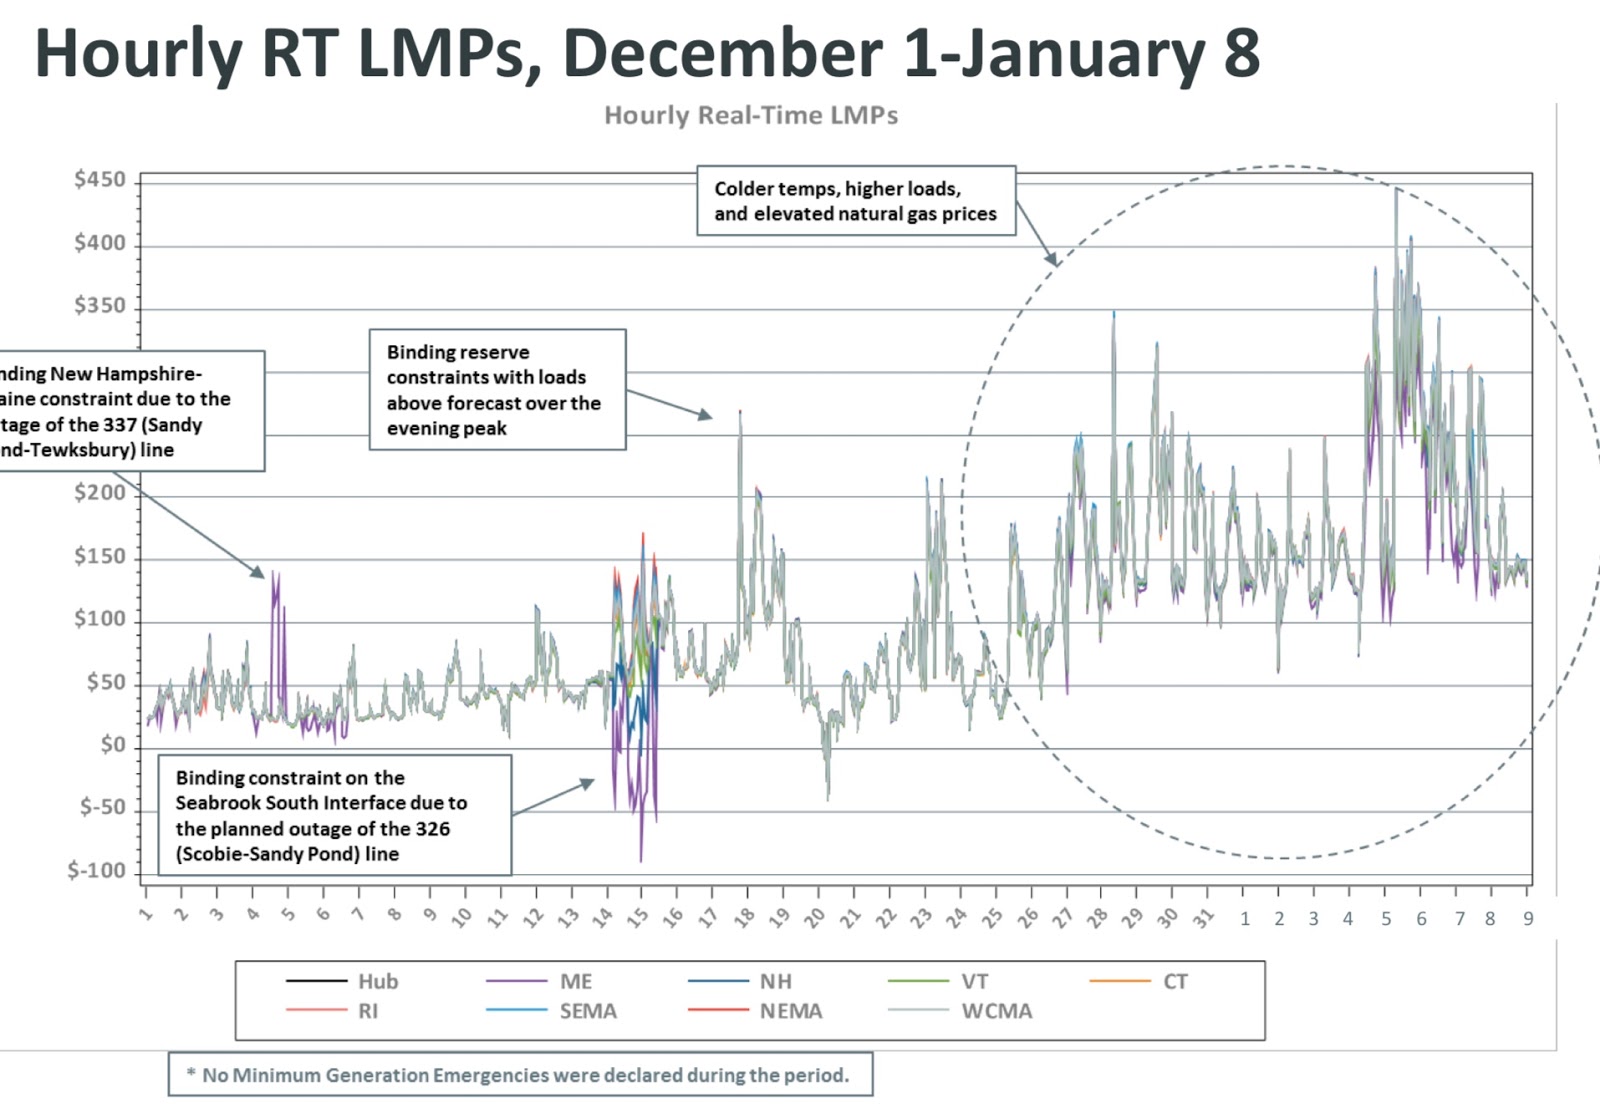
At a recent meeting of the Consumer Liaison Group for ISO-NE, James Bride of Energy Tariff Experts provided excellent graphics on this subject. (See slides 9 and 10 of presentation below, one of which is included above.)
http://www.iso-ne.com/static-assets/documents/2015/10/clg_james_bride_keynote_presentation_10_9_2015.pdf

The Second Auction and the Capacity Payments

To pay plants to be available, plants now bid into a second auction, an availability auction called the Forward Capacity Auction.    As you can see in the following chart (prepared from ISO-NE data by Entergy, and used with their permission), the Capacity Auction made it possible for gas turbines and peaking plants to make up enough money to keep operating.  The capacity auction found the missing money for some of the plants.

As you can also see, nuclear plants get most of their money from energy payments, not capacity payments.  That is because nuclear plants make so many kWh, compared to other types of plants with the same nameplate capacity rating.  Ultimately, of course, the grid is all about kWh delivered.

(See the sidebar below for sample calculations.)
Revenue streams for different types of plants
Courtesy Entergy and Nuclear Engineering International

Problems with Capacity Auctions

Capacity auctions did not completely solve the reliability problem. They find some missing money, for some types of plants. But what happens when the plant receives the capacity money, but then---later---when called upon to run by ISO, the plant doesn’t run?

ISO-NE and other ISOs were aware of this potential problem, and began designing Pay for Performance incentives. These incentives were to start in 2018.  However, meanwhile, the shale gas boom happened, and the grid became more and more dependent on natural gas. The ISOs needed something for winter reliability, something they could put in place more rapidly then Pay for Performance.

Capacity Auctions Mislead the Grid

Prices during a Polar Vortex
In many ways, the capacity auction results misled ISO about the amount of electricity that would be available to the grid in crisis situations.  During cold snaps, much less electricity was available than had been bid into the capacity auction. Natural gas power plants rarely have firm gas transportation contracts with pipelines.

The gas plants made firm capacity commitments to the grid but did not  have firm delivery commitments for natural gas supply. The Polar Vortex laid bare this problem.

In winter, the ISOs needed a quicker winter fix than Pay For Performance, so they started “winter reliability programs.”  These programs were started just in time. During cold snaps, gas plants not coming on-line was driving the grid closer to the situation where it would have to “shed load” in a cold snap.

The Winter Reliability programs were complex, including new types of auctions.  Basically, however, they supported plants to keep oil, CNG and LNG onsite to burn when gas was not available.  ISO paid for oil, or paid storage costs for unburned oil. FERC (the Federal Energy Regulatory Commission) approved the Winter Reliability programs on a temporary basis. But FERC disapproved of the fact that the reliability programs were not fuel-neutral, and ISOs are supposed to be fuel-neutral.  Therefore, FERC and ISO look forward to 2018, and PFP.

Pay for Performance

Pay for Performance (PFP), which will start in 2018, is supposed to be fuel-neutral. PFP is supposed to find yet another kind of “missing money.”  It is supposed to provide the economic incentive that would encourage power plants to come on-line when dispatched during tight situations on the grid.

Sadly, PFP isn’t actually market-based.  It is a complex regulatory system, basically jury-rigged, that satisfies FERC requirements by supposedly being fuel-neutral.

 PFP is a transfer mechanism from poor-performing plants to high-performing plants.  If a plant bids in capacity, but then does not provide energy (electricity) when called upon, it will have to forgo part (or maybe all) of its capacity payment for that month.  The loss of this money is a sort of penalty for the plant. This lost-money will be added to the capacity payments of plants that do perform during a high-load period, as a sort of bonus.

With PFP, a plant might well lose its entire capacity payment for a month if it doesn’t go on-line when it is needed. It might even owe ISO-NE money beyond its capacity payment. This would be quite a blow for a plant that depends on capacity payments, such as a natural gas plant. An ISO-NE hypothetical example shows a 100 MW plant losing or gaining $50,000, $150,000, and $350,000 dollars in a month, under various scenarios.  http://www.iso-ne.com/committees/comm_wkgrps/strategic_planning_discussion/materials/fcm_performance_white_paper.pdf

Nuclear plants may get some extra payments from PFP, but these payments would be part of their capacity payments.  For nuclear plants, capacity payments are a small portion of their revenue stream, and PFP will not make much of a difference to their pay stream.

The major effect that PFP seems to have had is to encourage all new gas-fired plants to be dual-fired, so they can keep oil on-site and keep their capacity payments.

As ISO-NE in their statement about Pilgrim closing: “Most of this new gas-fired generation is seeking to become dual-fuel capable, meaning they will be able to switch to use oil if natural gas is not available, or if the cost of oil is lower than that of natural gas.”
 http://www.iso-ne.com/static-assets/documents/2015/10/20151013_pilgrim_retirement_request.pdf


PFP Problems for Steam Plants

Steam turbine
With PFP, there’s a lot of devil in the details.  One issue is that it does not distinguish between various types of plants, and could penalize plants that raise steam.  PFP depends upon a complex formula which is the result of many debates on how to structure incentives for plants to be online.  The amount of the penalty/transfer payment depends on this formula, and the formula partly depends on the situation on the grid.

There is considerable concern that some of the PFP transfers will be random--power plants will be penalized or rewarded for situations they can do very little about. A representative from NEPOOL had harsh testimony against PFP. (NEPOOL is a voluntary association of New England energy market participants. It was founded about twenty years before ISO-NE.)  http://www.nepool.com

To quote Elin S. Katz, office of Consumer Counsel in Connecticut, testifying behalf of NEPOOL:  http://elibrary.ferc.gov/idmws/file_list.asp?document_id=14178339  (Katz testimony, available only by download.)
PI (PFP) creates excessive investment risk because.... PI’s substantial penalties would impact capacity suppliers that are not operating during particular five- minute intervals regardless of the reason why they were not operating. PI would ignore the actual operating characteristics of a power plant when levying penalties. 

Katz gives an example in which a steam power plant bids into the day-ahead market, is not selected for that market, but then it turns out that ISO-NE does need its power.  Steam plants cannot come on-line very quickly, and ISO-NE PFP assesses penalties on a five-minute basis. The problem in this case is actually the result of ISO’s imperfect prediction capabilities, but the fines will be paid by the steam power plant.

 PFP and Burning Oil

Well, PFP is messy, and PFP may be unfair.  Let’s ask another important question, though. Will PFP help nuclear power?  Will PFP finally reward nuclear plants for their reliability?

The answer is No.  PFP will not help nuclear plants. The main result of PFP has been for natural gas plants to commission or recommission dual fuel capabilities so that they can burn oil.

Nuclear plants get most of their revenue from energy payments, not capacity payments.  Nuclear plants may get some higher capacity payments through pay-for-performance, but this will not make a big difference to them. The pay-for-performance transfer will make a difference to the peaker plants, which will have more of an incentive (however oddly arranged) to become dual-fuel or make other arrangements to be able to come on line when called.

Are RTOs really a market?

The whole RTO situation is getting pretty far from “a market,” as markets are usually considered.  Nuclear power plants in RTO areas of the United States are not well valued for their steady performance and PFP will not change that.  Meanwhile, the RTO market-solution is becoming an increasing series of tweaks and attempts to keep the grid operating smoothly. The tweaking in RTO areas (including PFP) is interesting and complex, and it becomes more complex all the time.

Complex markets become complex as they are regulated to achieve certain goals.  In general, RTO markets favor plants with low capital costs, high fuel costs and low utilization compared to plants with high capital costs, low fuel costs, and high utilization.  This is the outcome of the current market design.

 In other words, RTO markets are unfavorable to nuclear power. Whether this outcome was a goal of the design (a feature) or an unintended consequence (a bug) is not clear.  At any rate, despite all the tweaks, RTO markets allow local grids to move to heavily to natural gas, despite problems with gas delivery. Except for dual-fueled plants, Pay for Performance will make little difference.

------
RTO auction sidebar: Doing the math for capacity payments

RTOs generally run two types of auctions: a real-time energy auction, and a Forward Capacity Market auction.  Both auctions work basically the same way: Plants bid in to supply either kWh right now (energy auction) or capacity availability some years in the future (Forward Capacity Auction). The auction requirements fill from the bottom--the least-cost plants are selected first.  In both auctions, plants usually bid the lowest price they can bid, to be sure they are chosen.  The RTO has to fill its needs, however, so it cannot just choose a few low-price plants.  At some point, with higher-priced plants, the RTO requirements are filled. In both auctions, all the bidders get the payment for the highest price plant that is accepted into the queue.  The auctions are meant to move prices in synch with demand, and always provide the lowest price that meets the demand.

Where do different plants get their revenue under this system?

Let’s look at an overly simplified example:

Let us assume that we have a price on the grid of 4 cents per kWh, and a capacity price of $3 per kWmonth. (This is a very rough approximation to the situation on the New England grid recently.)

We imagine a 500 MW nuclear plant and a 500 MW combined cycle gas plant.

  • They will both get the same capacity payment of $1,500,000 per month, because they have the same capacity.  
  • The nuclear plant has a 90% capacity factor, and earns approximately $13 million for energy payments. 
  • The combined cycle gas plant capacity factor is about half of that of the nuclear plant (around 40-50% capacity factor, according to EAI, I am assuming 45%), so it makes half the electricity as the nuclear plant. It earns approximately $6 million in energy payments. 

In this highly simplistic case, the capacity payment for the nuclear plant is about 10% of its revenue stream, but it is 20% of the revenue stream for the gas plant.  If the gas plant were a “peaker,” running about 10% of the time, it would receive the same capacity payment as the other two plants. However, it would earn only $1.5 million in energy payments. For a "peaker" plant,  capacity payments could be about half of its revenue.

One way in which this analysis is overly simplistic is that the gas-fired plants are likely to only be on the grid when the grid prices are running higher than average.  Nevertheless, this gives a high-level overview of capacity and energy payments for various types of plants on the grid.

For a nuclear plant, even a small decrease in energy prices can override a modest increase in capacity payments. This is the main reason why PFP will not affect nuclear economics very much.


Monday, November 21, 2016

The Future of Nuclear in RTO Areas

RTO areas in North America.  Based on FERC data
FirstEnergy plans to close or sell its nuclear plants

In a recent post at ANS Nuclear Cafe, Will Davis wrote about some changes that may happen  in the nuclear landscape in the near future.  He reported on statements made by FirstEnergy CEO Charles E. Jones at the Edison Electric Institute financial conference on November 7.

Here's a direct link to Jones' presentation: FirstEnergy: Transforming to a Regulated Company As Davis describes in his article, FirstEnergy is attempting to get out of the competitive electricity markets and become a fully-regulated utility. If it cannot support marginal plants in competitive markets, it will sell or shut down those plants.

Looking at the Earnings Per Share slide (slide 12 of the Jones presentation), you can see why FirstEnergy might get out of the competitive market.

  • At a "basic Earnings per Share" level,  Competitive Services are losing around $2.50 per share.  
  • Adjusted with "special items," Competitive Services are earning around $0.50 per share.  
  • Regulated Distribution and Regulated Transmission are always in the black, with or without "special items."  
  • Regulated Distribution, for example, earns around $1.80 per share, overall.

This is a big deal, because FirstEnergy operates in Ohio, Pennsylvania and New Jersey.  Selling its nuclear plants (and coal plants) will be a major change and disruption.  I encourage you to refer to the Davis article for more specifics on this, and for other links.

Is FirstEnergy following the Entergy exit pattern?

In all the excitement about Entergy announcements of Vermont Yankee closing, Pilgrim closing, and the sale of Fitzpatrick to Exelon,  it is easy to overlook the fact that Entergy may be following a similar strategy of exiting the "deregulated" areas.  In December, 2015, Entergy announced the sale of its gas-fired plant in Rhode Island to Carlyle Power Partners.

At this point, except for Indian Point in New York, I think all Entergy power plants in deregulated areas are either slated for closing or slated for sale.  To me, this looks like the same "exit the deregulated areas" strategy that FirstEnergy is now pursuing.  Both companies have extensive regulated operations, as well as operations in deregulated areas.

Oops: I should have said Entergy has been exiting its holdings of plants in the Northeastern RTO areas.  Entergy Wholesale Commodities also owns Palisades in Michigan. http://entergy.com/ewc/

RTO areas

Clearly, there's a lot to say about these exits, and about the implications for our power plants of all kinds. And of course, if you know me, you know my deep and abiding cynicism about the deregulated areas: see The Oddness at the Heart of RTO.  These areas seem to be more about "tweaks R us" than about market forces.

For now, I will reprint my comment on the Davis article. This subject needs far more discussion than is possible in a single blog post.

It's not just about the price per kWh

Will

Thank you for this article. The RTO areas are basically stacked against nuclear and other baseload plants.

People will say: “Yeah, well, those plants just can’t compete with cheap natural gas.” That is not the case. Actually, in RTO areas, many or most natural gas plants get much of their income from selling “capacity” and “ancillary services,” not from selling kWh. Look at this slide from one of my articles: Payments for various types of power plants on the New England grid

As you can see, nuclear gets most of its income from selling kWh (gold bars) while NG/Oil GT (gas turbines) get around 80% of their income from “capacity” and “auxiliary” payments (blue and brown bars). That’s because the gas plants don’t sell as many kWh as nuclear sells, and you can also see that if the price of a kWh goes down but the capacity payments go up…the gas plants are all right. The common description of the “low price of natural gas on the grid” accounts for low-price sales of kWh, which are nuclear energy’s life and breath. It doesn’t account for all the ways the grid supports low kWh prices and makes up the difference…for plants that don’t run very much.

This has also been called the “search for the missing money.” Natural gas plants, without capacity payments, would have to charge more per kWh or go out of business. But…most RTO areas supply the gas plant’s “missing money” in a way that hurts any high-capacity-factor plant on the grid.

(Note: CC is combined cycle, ST is steam turbine, GT is gas turbine.)

- See more at: http://ansnuclearcafe.org/2016/11/16/november-news/#sthash.EyWLASTY.dpuf


Sunday, September 4, 2016

On Pat MacDonald's TV show about Clean Energy Standards, Grid Payment

I was on Pat MacDonald's show, Vote for Vermont.  The motto of her show is "Listening Beyond the Sound Bite."  I appeared on her show last year, also.  The recent topic was "Life After Vermont Yankee, part 2."   We covered a lot of ground, and had a good time!

Our discussion included:

  • The New York Clean Energy Standards and what they mean
  • Payments on the grid, and what types of plants get subsidies
  • Effects of Vermont Yankee closing 
  • Carbon dioxide footprints
  • My upcoming book
A hearty thank-you to Pat for inviting me on her show, and for all the preparatory work she does before a show.  I hope you enjoy watching!


My opinions about payments to gas-fired plants

In  my opinion, gas-fired plants get major subsidies, but they call it "capacity payments." Nuclear plants get these also, but capacity payments are a very small portion of the income for nuclear plants.  Capacity payments are a major portion of the income for gas-fired plants.

 If gas-fired plants had to make their money selling kWh, they couldn't sell kWh as cheaply as they do.  If gas plants didn't get capacity payments, but had to make their money selling kWh, nuclear plants would be very competitive, even with currently-low gas prices.

Some back-up for my statements:
My  post on the New York Clean Energy Standards: Clean Air versus Efficiency Charges. Clean Air Wins.
My article in Nuclear Engineering International magazine, about payments on the grid: Pay for Performance and the US grid. 

Update: This video was chosen to be the Friday Matinee at the ANS Nuclear Cafe blog.  I am very pleased!  Life After Vermont Yankee, Part 2--An Interview with Meredith Angwin

Wednesday, May 25, 2016

The Distribution Grid: Christine Hallquist on Grid Controversies

Hallquist and the grid

Christine Hallquist, CEO of Vermont Electric Cooperative, presented the third class in my course: The Grid: What Your Electricity Bill Won't Tell You.

On May 3, 2016 at my class on grid issues, Hallquist described the grid  from the perspective of a rural electric cooperative in Vermont. She heads Vermont Electric Cooperative (VEC). This utility was one of the rural Cooperatives of the Rural Electrification movement: it was founded in 1938 to bring electricity to rural Vermont.  It is now the largest locally-owned electric distribution utility in Vermont.  VEC is dwarfed by Green Mountain Power, a utility with a very Vermont-y name. However, Green Mountain Power is actually a wholly-owned subsidiary of Gaz Metro of Quebec.

In my opinion, Vermont Electric Cooperative is the quintessential Vermont utility. It started in the Rural Electrification movement of the 30s, and and it is a cooperative in which the owners and the consumers are the same people.

Update 2018: The videos still exist, but their URLs have changed. Here's the link to this video.
https://www.youtube.com/watch?v=4zN0D_CAkKE


As CEO of VEC, Hallquist is concerned with the cost shifts involved in net metering, since  VEC's service area includes low income areas of Vermont. When your owners are your customers, you pay sincere attention to the economic issues.

Late in the talk, Hallquist also discusses grid stability.  Intermittent power tends to be destabilizing: the grid was set up for rotating electric machinery. Rotating machinery has a healthy inertia which helps keep the grid stable. Starting at about 1:20 (1 hour 20 minutes into the talk), Hallquist shows the jagged effects of wind and solar, and the almost un-analyzable harmonics of the intermittents on the grid.  Few utilities collect this type of data.

I am very grateful to Christine Hallquist for sharing her information and her wisdom with our class.

It happens first in a village

Agatha Christie's Miss Marple is able to solve crimes because she has carefully analyzed many (supposedly) smaller issues in a small village.

To a large extent, Vermont Electric Cooperative is a "village" for the growth of renewables.  The owner/customers are not rich, and they need to keep electricity costs low.  While places like Germany can boast of their renewables while simultaneously building lignite-fired plants, VEC is actually adding renewables and dealing directly with the costs and stability issues that renewables  present.

For example,  the owner/customers have made decisions, very recently,  on how to keep wind energy from being curtailed on their grid.  They are making decisions, right now, on how much net metering the customers can afford.

VEC is hopeful about advances in energy storage and weather forecasting and so forth. (See Hallquist's last slide on "What are we doing about it.")  But right now, there are very real limits for renewables on a small grid, and VEC is reaching those limits.

-------
Previous sessions 

The first session was The Grid: Power and Policy Introduction, and Howard Shaffer on the Physical Grid.  The second session was Payments on the Grid: What Every Citizen Should Know.  This post is the third session.  The fourth session was a field trip to ISO-NE, the grid operator headquarters.


Tuesday, May 17, 2016

Payments on the Grid: What Every Citizen Should Know

Payments on the Grid

In my opinion, payments and policy on the grid will determine our future energy mix.

Most people believe that they know about power sources: gas, nuclear, hydro, coal, solar, wind.  We know what the plants look like, and we have opinions.

In contrast, most people know almost nothing about the grid: how plants are dispatched, how plants are paid, what the controversies are.  Yet these grid-level decisions will determine our power mix in the future.


Update 2018: The video still exists, but its URL has changed.
Here's the new URL.
http://reflect-catv.cablecast.tv/vod/4853-OSHER-Grid-Class-2-April-2016-Medium-v1.mp4

I think that most people will learn something from watching this video, and pro-nuclear people will find it especially interesting.

(The first class session consisted of an introduction to the course, followed by an introduction to the physical  grid. Howard Shaffer gave the guest lecture on the physical grid. The entire first class session is posted at The Grid: Power and Policy Introduction and Shaffer on the Physical Grid.)

Tuesday, May 10, 2016

The Grid: Power and Policy Introduction and Shaffer on the Physical Grid

I gave a three session course at OSHER, called The Grid: What Your Electricity Bill Won't Tell you.

The first session was an introduction to the course (power and policy) and Howard Shaffer's explanation of the physical grid....that is, electricity and how it flows.

The second session will be about policy and controversies on the grid, and the third session was the guest lecture by Christine Hallquist, CEO of Vermont Electric Cooperative.

Because of the interest in the course, our local Community Access TV (CATV8) station videotaped it, and is also putting it on VIMEO.

I embed the first video below.


Update 2018: The videos still exist, but their URLs have changed.  Video link below.

http://reflect-catv.cablecast.tv/vod/4807-OSHER-Grid-class-April-2016-Medium-v1.mp4

Sunday, April 17, 2016

The Grid: My Course at Dartmouth OSHER

The Course

I have been quite busy in the past week, getting ready for the launch of my four-week course about the grid, The Grid: What Your Electricity Bill Won't Tell You. The course begins at OSHER at Dartmouth,  Tuesday, April 19.    Here is the course catalog description.


And here is a slide from my Tuesday April 19 presentation.


The Guest Speakers

I don't know why everything is taking me so much time!  I have two great guest speakers, and we are taking a field trip to ISO-NE headquarters the last day of the course.  With all this help, it should be easy-peasy for me to get ready for the course.  Right? Okay.  It's hard.

The guest speakers:

Howard Shaffer was a startup engineer on a major pumped storage project.  He will speak on the first day, about the physical grid. Here is Shaffer's post about the difference between supplying power and paying for power.  Where's the Magic Switch?

Christine Hallquist, CEO of Vermont Electric Cooperative, will speak on controversies on the grid. Here is Hallquist's recent op-ed at VTDigger: Pricing Renewable Energy Right.

Videotape

The course will be videotaped for CATV8  community TV, and it will also be on-line.  I will put links to the videos in some later blog posts. (In other words, I will be videotaped three times, and  I haven't got a thing to wear.)


Wednesday, March 9, 2016

The Oddness at the Heart of RTO

RTO graphic from FERC
Regional Transmission Organizations

Tomorrow, I will be at the ISO-NE Consumer Liaison Group meeting in Connecticut. (I blogged about this meeting a few days ago.)

I would like to share my research, and my feelings, about the deep oddness at the heart of American RTO markets.  RTO (Regional Transmission Organization) markets are those in which electricity generators (power plants, etc) and electricity transmitters (transmission and distribution companies) are generally different companies. The different types of companies interact by participating in complex auction processes.  In contrast, non-RTO markets contain (mostly) vertically integrated utilities.  In non-RTO areas, usually the same companies are in charge of both generation and distribution.

I recently wrote an article for Nuclear Engineering International magazine "Pay for Performance on the U.S. Grid." This article shows how the supposedly cost-saving auctions have diverged farther and farther from anything resembling a free market. It also shows how the RTO markets basically punish reliable plants, and support unreliable plants.  

In this figure, based on Entergy research, we see that nuclear plants get around 85% of their revenue from selling kWh, (energy) while gas plants get 40% to 80% of their revenue from other sources (capacity payments, ancillary services payments.)  In this figure, based on information from James Bride of Energy Tariff Experts, we see how Capacity Payments make up the revenues for gas peaker plants. (I don't own the figures, so I have to link to them.)

If gas plants had to subsist on the prices they received for energy, if gas plants main income was the money they receive for selling kWh on the grid, it would be much harder for gas plants to undercut nuclear pricing!

I encourage you to look at the figures and read the article.  My article has a reasonable title: Pay for Performance and the U.S. Grid.  When I think about it, I refer to it as The Oddness at the Heart of RTO.

RTOs don't even save money

Well, all those complicated auctions were supposed to prevent big nasty integrated electricity companies from ripping off consumers. (The companies would rip off consumers after they had "captured" their regulators, of course.)  So, did it work?  Did the the RTO auctions and free markets lower prices for electricity?  I would argue that RTOs are not really free markets anyway (read my article), but in the meantime....did RTOs save money for the customers?

Well, no.  Or maybe yes, maybe no.

Here's another chart, this one is part of a paper prepared for NESCOE,  New England States Committee on Electricity, which "represents the collective perspective of the six New England governors in regional electricity matters."   The paper was published in December, 2015.  "Electric Restructuring in New England--A Look Back" prepared by Reishus Consulting LLC.
From a study at UC Berkeley, as reported in NESCOE review

This is a chart of retail prices over time. Note that the Restructured States (RTOs) have the highest prices for retail electricity. Yes. That's the red line at the top of the chart.

It must be added, however, that the Reishus Consulting paper also describes other studies that claim to find lowered retail electricity costs due to restructuring.  I would say that the statement that "RTOs save money for consumers" is not currently proven, to my satisfaction, and it looks as if they don't.  After all, that top cost line is the restructured (RTO) states.

The effect of RTOs

In short, RTOs may or may not save money for consumers. My opinion: probably they don't.

Undoubtedly, however, RTOs make to make it harder  for reliable plants to survive, and easier for unreliable plants.

All the nuclear plants that are in danger of closing are in RTO areas.