Showing posts with label natural gas. Show all posts

Wednesday, February 7, 2018

The Oil-filled Grid: Communications

Early January Nor'Easter
Wikimedia, NOAA
Oil on the Grid

About two weeks ago, I wrote a blog post The Northeast Grid and the Oil. This described our early-January polar weather, and how Northeastern power plants could not get enough natural gas in the below-zero weather. Homes had priority for natural gas delivery, and plants that could use oil switched from natural gas to oil.

As a matter of fact, the oil stocks were also getting depleted.

I want to update the cold-snap story with some other posts. The general public doesn't read my blog, so I did some outreach. I wrote an op-ed about the grid for my local paper, the Valley News.  The op-ed was printed on the front page of the Sunday Perspective section on January 28, and has been shared around 200 times on Facebook. Oil Kept the Power Grid Running in Recent Cold Snap.

Why were people so interested in the article?  Because a secure electric supply is an important part of personal safety during extremely cold weather.  Most home furnaces require electricity to spread the warmth into the household. People who have chosen heat pumps are also dependent on reliable electricity.

Nuclear plants and pipelines and controversy, oh my!

There were more articles on the situation, of course, not just mine.  Actually, I think there were too few articles.  Nearly running out of oil when you can't get gas---this can be a major deal during severe winter weather! I will point out some interesting articles, and I hope that people who read this will send links to a few more.

Rod Adams post described the "sobering statements" made by the grid operator about oil supply, and the weird statements made by nuclear opponents.  (Pilgrim should have shut down before the storm? Really?) He shares some graphics from ISO-NE on the weak performance of solar panels during the days of the crisis.  He also discusses Pilgrim going off-line, and whether that could have been prevented. As usual, his post has an active and informed stream of comments. Performance of the New England power grid during extreme cold Dec 25-Jan 8, at Atomic Insights blog.

Meanwhile, over at Forbes, several columnists were commenting on the situation.
Jude Clemente wrote What Happens When You Don't Build Natural Gas Pipeline
David Blackman wrote Amid Deep Freeze, New Englanders Can 'Thank' N.Y. Gov Cuomo For Their High Energy Bills
Christopher Helman wrote Natural Gas Demand Hits Record As Cold Bomb Targets Northeast

Over WBUR radio, Bruce Gellerman has a fascinating seven minute segment on how the power plants actually operated during the cold snap, including an interview with a manager of a peaker plant that runs about 800 hours a year. Do We Need More Natural Gas Pipelines?

There's a lot of controversy built into all these articles. The role of nuclear.  The need (or not-need) for more natural gas pipelines. Will new emissions regulations make handling the next cold snap much harder? Did renewables make a great contribution during the cold snap?  Or not?

The Electric Supply

A steady electric supply is hugely important to winter safety. In my opinion, it should not be such a subject of controversy.  My hope is that  reason will prevail, and we will have the nuclear plants, pipelines and energy security that we need.

Friday, December 29, 2017

More Cold and More Oil on the New England Grid

Oil Use Increases

Once again, I will tell this blog in a series of pictures.

In my blog of December 27, I showed a snapshot of the New England grid in the early evening.  The temperature at my location was 7 degrees, the local marginal prices (LMP) on the grid were running around $200 MWh (20 cents per kWh), oil was 22% of the fuel mix, renewables were 11% of the fuel mix (I remarked that this was on the high side for renewables) and the high renewable percentage was due to the wind energy.  Wind was 50% of the renewables.  The blog post was Successful encouragement of oil on the New England Grid.  The source of all the information (except the local weather) was the ISO-NE web page, ISOExpress.

That post was on December 27.  Yesterday, December 28, I noted that the percentage of oil had gone up above 30%, and the portion of renewables had gone down.  But I didn't write another blog post. My snapshot is below. (Double click on any graphic to enlarge it.)

December 28 fuel mix


Getting Colder, and Oil Use Stays High

Today, around 1 pm, the temperature was 1 degree, as show below. The weather had gotten colder.

1 p.m. December 29 temperature
The price of power on the grid had also gotten higher, around $300/ MWh (30 cents per kWh)

1 pm December 29 prices on the grid

Though I must admit that as I write this at 3 p.m, the price has fallen again to around $200/ MWh.  Also, note the color codes on the map.  The colors show the prices graphically.  Closer to red is higher priced.

Oil use has stayed high, from December 28 evening (above) to one pm December 29, (when I took a bunch of screen shots) to right now at 3 pm.  Oil has been between 30 and 32% of the grid.

December 29, oil is around 30% of grid power

Not as much wind on the grid

What about the renewables?  On December 27, a windy day, renewables were at 11% of the grid, and wind was 50% of renewables.  (See my December 27 post for the graphics on this.)

Today, at one pm, not so much wind.  It was actually snowing rather gently.  At that time, renewables were only 7% of the grid power, and wind was only 13% of renewables.

Renewable mix on the grid. Wind at 13%.
 What next?

I think oil use will remain high until the cold weather is over, about a week from now.   The wind may spring up again in the evenings, or it may not.  Whichever it chooses.  Nobody controls the wind.  So renewables may continue at 7% or go up to 11% again.

On the other hand, we haven't really hit peak demand yet.  Here's a screen shot that I just took. This is the ISO-NE estimate of system loads today, and the actual loads up until 3 p.m.
System loads, as forecast
As you can tell in this chart, around 18 hours (6pm) looks like peak demand.  Check in and see if the percentage of oil goes up even further.  I'm going to check.  I'm curious.

Here's the link for these real time updates from ISO-NE, ISO Express. https://www.iso-ne.com/isoexpress/

In conclusion

Isn't it nice that you can store oil on site?  Maybe someone will notice what Rickover noticed: you can store nuclear fuel even more easily than you can store oil!  I wouldn't hold my breath for people to notice this.  (/snark)

Meanwhile, I will check back at about the grid at 6 p.m. but I won't be posting. I leave the evening results as "an exercise to the reader."

Wednesday, December 27, 2017

Successful encouragement of oil on the New England Grid.

Cold in New England, and Going to Stay Cold

I decided to tell this blog as a series of pictures.  

I will start with a screen shot that I took of the weather report, at about 5:30 this evening. (Note that "Hartford" refers to the town of Hartford Vermont, where I live.)  It was 7 degrees F at that time, with a drop to minus 16 expected tonight.  The next few days are expected to have single digit high temperatures and minus temperatures of two digits (minus 10, etc)
Weather at 5:30 pm and forecast

So, how is the grid doing? Fairly well, actually.  At 5:30, I took this picture, showing that the LMP (local marginal prices) were running at about 20 cents a kWh. ($200 a MWh translates to 20 cents per kWh.) The graphics below are screen shots from ISO-NE. I took my snaps at 5:30 at this ISO page, which is updated every 5 minutes. https://www.iso-ne.com/isoexpress/

Grid prices and electricity use at 5:30 p.m. and throughout the day

As you can see by the retrospective graphs to the left of the map, prices have been up and down between $100 and $250  (10 cents and 25 cents per kWh) most of the day.

Oil on the Grid

During cold snaps, gas pipelines must supply homes first, and gas-fired power plants get short-changed.  ISO-NE has a Winter Reliability Program which mainly compensates gas-fired power plants for keeping fuel on site: oil or LNG or CNG. (Liquefied or compressed natural gas.) The grid was running about 22% oil at 5:30 this evening.

The current Winter Reliability program is described in an update presentation, given December 7,  2017  by Anne George of ISO-NE. On page 5, Ms. George describes the current winter reliability program, which pays oil and gas fired generators to have fuel on site.  (Page numbers are at the lower right of each viewgraph.) On page 18, she describes how the forward capacity auctions are attracting new generation, even as older plants retire.  Specifically, ISO-NE is attracting new dual-fired natural gas resources: gas turbines that can also burn oil, and therefore can store oil on-site for cold weather.

ISO-NE's attempt to provide winter electricity by encouraging oil use in cold weather is working.  The next picture shows (among other things) the fuel mix at 5:30 on the New England Grid. 

Fuel use at 5:30 p.m. and throughout the day
You can see that 25% of the electricity was supplied by nuclear, 24% by natural gas, 22% by oil, and 11% by renewables.  Usually, the grid runs closer to 50% natural gas and just a few percent oil. If you go to viewgraph 19 of the ISO-NE presentation,  you can see that natural gas is expected to be 55% of normal generation, and oil is the merest sliver on the graph.

The Renewables

In the chart above, renewables are making 11% of the power on the grid.  This is on the high side. (Viewgraph 19 of the ISO presentation shows renewables making 5%, for example.)  The high contribution of renewables is due to the wind.

In my experience of New England, really cold weather is often deathly still.  Not this time.  The wind is blowing, the windchill factor is serious, and the wind turbines are making considerable amounts of energy.  Wind turbines are making 50%  of the renewable power on the grid, as you can see in the chart below.  Basically, the other 50% of the renewable power is being made by burning wood and refuse. That power is pretty steady: the wind contribution goes up and down.

Since wind is making half the renewable power on the grid, and renewables are making 11% of the power on the grid, therefore,  the wind turbines are making 5.5% of the power on the grid. 

 The chart below shows the percentage of renewables on the grid at 5:30 p.m. 
Renewables on the grid at 5:30 p.m. 50% of the renewable power is from wind

The End of the Grid Tour

I am pleased that it is both cold and windy. (Actually, I am not that pleased about it. I have to live here, after all.)  I also know ISO must be fuel-neutral, so dual-fuel gas-fired generators are considered good. However, I can't help but think that using more oil in the winter is a step back for New England, not  a step forward.  

If you want, you can go to the ISO site, and watch the grid.  Or if you don't live in New England, look up your own grid, and do a compare-and-contrast. I would love it if you would comment on this article.

(An article from about four years ago in similar weather: The Cold Truth on the New England Grid.)


Thursday, December 1, 2016

Nuclear vs Gas Economics Part 2: Guest post by Nick Escu

Nuclear Power vs. Natural Gas Power 3 Year Projection (Part 2)
By Nick Escu
LNG unloading arm in Japan

Part 1  of this post basically explained a few facts from historical data:
  • Nuclear plants today are not as economical as natural gas generation plants are today.
  • Natural gas prices have consistently had ups and downs. When natural gas prices are high, nuclear plants become very profitable. When natural gas prices are very low, nuclear plants become unprofitable.
Changing times and LNG

There are new kids on the block. Seventeen  new liquid natural gas export permits granted, and an additional  29 LNG permits partially approved (Energy.Gov-August17, 2016). This has changed the dynamic of the amount and pricing of natural gas leaving the US. There's a huge difference between U.S. prices and worldwide prices.

There is now a very positive indication that natural gas prices are rising, as in the case of the Henry Hub price for MMBtu in February, 2016 moved from $1.71/MMBtu to $2.98/MMBtu in October, 2016. A 75% increase in 8 months.

Will changes like this continue? Will there continue to be a such price changes?

EIA stats (November 14th, 2016) for November and December (Drilling Productivity Report) clearly show an increase production rate of 4% to 5%.

Why is this increase important?

Because as more of those 17 approved permits begin liquefying natural gas and exporting natural gas, the natural gas prices will continue to climb. More LNG (Liquid Natural Gas) produced and sold will increase the base US price for nat gas.

Natural gas producers will want to maintain their huge markups in the world. The world prices for nat gas, begin at the $17.50/MMBtu. Our prices here in the US are at $3.00/MMBtu, or an almost 600% markup value for natural gas. Huge profits from exporting gas from in the US.

LNG export abilities set to grow

A portion of the first LNG permit, licensed to Cheniere in Louisiana, has come on line, February, 2016.
Cheniere, in Louisiana, will produce 2.1 Bcf/day of LNG. But the total for all 17 approved permits, and the 29 partially approved permits will equal 53.8 Bcf/day of LNG for the world.

So now we clearly see why production of new wells and output has increased for the following 2 reasons.
  • First, the need to maintain the profit margin between US nat gas production and world nat gas demand. 
  • Second,  to have sufficient stock available for all 46 LNG exporters.

Nuclear power becomes profitable at about $4.75/MMBtu spot nat gas.

So Cheniere was the first test, with just their first unit out of 6 units.  Their first unit caused a gas price increase of 75% increase in 8 months. Now the market has balanced. But it will not be balanced for long!

The LNG exporters will need over 25 times the amount of nat gas and what we will see are nat gas prices following each new LNG exporter when they come online.

By the end of 2016, Cheniere’s Sabine Pass Trains 1 & 2 will be in operation.  In 2017, another three trains will probably start, some from Cheniere and others from Dominion’s Cove Point. By the end of 2018, five more new trains* may come online from Cameron, Freeport and Corpus Christi. Another four trains are due online in 2019 from Freeport, Corpus Christi and Sabine Pass. US LNG exports have only just begun.

We will see the nat gas prices rising in 2017. By the end of 2017, that $4.75/MMBtu price will be reached and every nuclear plant will again be competitive.

Think about the zero pollution from nuclear power plants versus all the pollution that the new natural gas power plants the world will produce.

Enough for now.

------

Nick Escu is the pen name of a person with long experience in the power industry.

* A natural gas liquefaction facility consists of separate units, called "trains," each of which is set up to purify and condense natural gas.  So a facility can have one train or several.  Cheniere will have six trains.

Tuesday, November 29, 2016

Nuclear vs. Gas Economics, a Three Year Projection. Guest post by Nick Escu

Nuclear Power vs. Natural Gas Power 
A Three Year Projection
By Nick Escu


The power industry continually looks for a stabilized grid demand to operate profitably, economically and reliably.

There are several key factors the power industry looks at to determine these needs are met.

Profitability is determined by how much generation costs, plus outstanding production and grid costs are entailed. Factors affecting generation are fuel costs, labor costs, parts costs, plus new regulations, plus changes in overall demand.

Costs

We’re going to look at current nuclear power costs and three-year projected nuclear power costs, as well as current natural gas power costs and three-year projected natural gas costs.

We are not going to look at the huge increase in air pollution and power production costs caused by natural gas versus nuclear. These facts are readily seen in Germany which eliminated nine of its nuclear plants in favor of natural gas and a little wind and solar.  It has shown a 25% increase in power costs. Similarly,  Japan has at present, shut down all of its nuclear plants, with a huge increase of air pollution and power costs. Similarly in California which shut down two nuclear plants with subsequent air pollution increases and rising power costs. Enough has been written  about these examples, and will continue to be written in the future.

Let’s begin our analysis.

Selling price

We will first look at basic selling price of nuclear power per megawatt hour versus natural gas power per megawatt hour.

The EIA actual selling prices as of January 2013 for Mid-Atlantic generators were $32.00/ megawatt hour, and for the Midwest were $25.00/ megawatt hour.

Nuclear power plants are base load plants. They operate at 100% of their capacity for over 90% of their operating time. So when a nuclear plant is contracted to produce power to maintain the electricity grid in their region, they must operate. For most nuclear plants, the breakeven costs for power production are between $32.00 and $35.00 per megawatt hour. Anything less and that plant is losing money. And most businesses, unlike the federal government, do not operate on a loss revenue basis. They are in business to make money.

Natural gas

Now let’s look at natural gas power production costs.

In February of 2003, according EnergyOnline  the electric production costs were $990 per megawatt hour in Texas and New York City costs were $175 per megawatt hour.

But because of the tremendous fracking, current natural gas electric power production costs have dropped to $28.50 per megawatt hour in November, 2013, according to 4 Traders.

So we can see that if you have a nuclear plant that runs very economically producing power at $32.00 per megawatt hour and you also have a natural plant that generates power at $28.50, the logical choice would be to turn off the nuclear plant and make $3.50 for every megawatt hour.

Let’s put it in simpler terms. A 1000 megawatt power plant should run 8760 hours per year (the total hours in a year 365 X 24 =8760). Normal maintenance is about 10% of that time, so let’s subtract 876 hours for a net total of 7884 operating hours. Now let’s multiply that $3.50 more money the gas plant makes over the nuclear plant, times those hours, and those megawatts.

$3.50 X 7884 X 1000 =$27,594,000. This is the yearly gross profit a natural gas plant has over the nuclear plant.

If that was all we had to determine profitability and future projection, it would be a No Brainer. We’d shut down the nukes today, as long as we had plenty of natural gas plants.

But there another factor we must consider for the bottom line.  Short term versus long term.

Short term and long term

I’m an electrical contractor working in the power industry. A few years ago someone came to me and offered me $100 per hour to work, and the work involved 80 hours per week. Since I was between contracts, I took the assignment for a 2 month period of time, and made a nice chunk of change.

Shortly thereafter I took a 2 year assignment at $65 per hour, for a 60 hour work week. In the middle of that assignment the contracting group I’d previously worked at attempted to get me to go on an assignment to the same place, for a 3 week assignment. If I had known they were going to call me back, I could have let the new group know I’d be away for 3 weeks.

My decision was simple. I stayed with the 2 year assignment. Why? Because for the long haul, it was more profitable.

Sometimes short term profits cloud our judgment over the long haul.

Fuel cost trends

Back to natural gas.  I began this section by stating that in 2003 natural gas production costs were between $175 to $990 per megawatt hour.

So now let’s look at the consistent biggest cost to nuclear plants, the cost of nuclear fuel.

In 2003 nuclear fuel costs averaged $57,000,000 for a 2 year fuel cycle for a 1000 megawatt power plant. 2013 average cost for the same fuel is $60,000,000, or a 5% increase over the past 10 years or an average of 0.5% per year increase for nuclear fuel.

Natural gas prices decreased from $990 to $28.50 or a 97.2% decrease in power production cost.

But is that price of $28.50 per megawatt stable or is it changing?

The World and Us

Let’s look at the world prices. The prices vary from $57.00 per megawatt hour in Europe to $116.00 per megawatt hour in Asia. Why? Because of fracking here in the US, our prices are so low. That guy on TV says “We have enough natural gas for 100 years” remember him?

But a new factor has risen, LNG exporters. The President has signed 17 permits to now export liquid natural gas to all those places willing to pay a little less than what they have now. So what will that do to our US prices of natural gas??? Do you really believe our gas prices will decrease?

No, all of you are realistic. Our prices will increase.

A good example is that gasoline in the Emirates was a few years ago $0.25 per gallon, but today it’s about $0.70 per gallon. Why? Exporting your home product raises your costs locally. In the Emirate’s case, almost 300% increase.

Let’s be conservative and say our natural gas prices will only double here in the US after we start exporting. How long will that be?

The LNG export sites are even as we speak, running new power lines for the 11,000 and 12,000 horsepower compressors that turn the gas into a liquid. Estimates at present are 3 years (or 2020) for the last permit construction completion and production beginning and exporting.

Cheniere began production and first export happened in mid-February, 2016. Natural gas price in late February, 2016, was $1.71/MMbtu (Henry Hub). As of the end of September, 2016, the price for nat gas had risen to $2.99/MMbtu, a 75% increase in less than 9 month.

So do we really want to completely shut down a minimum producer like a nuclear plant today, when in 2 years it will be worth twice its value?  It’s a penny wise pound foolish decision.

Nuclear and Us

The optimum plan would be, pay for, build and use the gas generation now, and temporarily place the minimal nuclear plants in a hold status, much like had been down at Brown’s Ferry and Bellefonte. The stability we’ve seen with nuclear power far outmatches in price fluctuations what we’ve seen in natural gas.

Let’s see how a closed nuclear plant power production has been supplied.

Vermont Yankee closed December, 2014. VY was a 620 MWe plant supplying most of the electricity generated in Vermont (72%). Gets a little tricky here. So what replaced the nuclear baseload power?

Right, natural gas.  The rise of gas on the grid almost exactly replaced the fall of nuclear on the grid.  Green Mountain Power distributes most of the power in Vermont, and they are wholly owned by Gaz Metro of Quebec.  Gaz also distributes nat gas through Vermont Gas Systems.  This is a company that is always happy to see more gas on the grid, and more energy imports from Canada.

Additionally, the Vermont government and Green Mountain continue to purchase power produced by YES, You Guessed It, Seabrook Nuclear Plant.

Now most all of Vermont is dependent on nat gas. And everyone is begging for larger natural gas pipelines, because no nat gas, NO POWER! Great move ecologically minded Vermont. 200,000 Vermont homes using electricity from natural gas instead of nuclear produce the following: 38,000 tons of NOx, 78,000 tons of SO2, 96,000 tons of CO2, and 104,000 tons of particulates. But all those numbers were at or near ZERO tons with Vermont Yankee Nuclear plant????

How about Connecticut? What’s their gas situation like? Legislators were just denied new nat gas lines, because under FERC guidelines, all required consumption must be contracted prior to build out of pipelines. Sorry Connecticut. No contracts, no new nat gas pipelines.

To be continued

----

Nick Escu is the pen name of a person with long experience in the power industry.

Sunday, October 30, 2016

Pro-Nuclear Rally in Chicago

Pro-nuclear activists in front of fossil lobbyist offices, Chicago
Pnoto courtesy of Environmental Progress 
The March

The weekend of October 22, 2016, I joined about 70 pro-nuclear people in Chicago.  We held a planning session and protest march. The march showed visible and effective support for keeping Illinois nuclear plants open.

The marchers gathered in front of ELPC,  an anti-nuclear lobbying organization that proclaims itself as an environmentalist group.  Their offices are at 35 East Wacker Drive. The picture above this post shows our group outside their offices.  (I went on the march, but did not continue as far as the building.)

Why did Clean Power Coalition decide to target this anti-nuclear group?  I was not involved in the decision-making, but I think I know.  At this point, we have to get back to basics.  Who opposes nuclear power, and what can we do about it?

The main thing we can do is:  Encourage pro-nuclear public opinion. 

Nuclear opponents and the fossil lobby

If we are encouraging nuclear energy, who do we consider to be opposing it?  Unfortunately, there are many groups that have claimed the mantle of “environmentalism” while making it their business to oppose the most effective source of clean energy in the world.

I think we have to stop calling these groups “environmental” groups.  They aren’t.  They are in the business of lobbying and campaigning against nuclear energy.  Many of them get well paid for their efforts: by fossil fuel companies.  Not all are paid by fossil fuel companies, of course.  But some are.

For example, let’s look at the Environmental Progress fact page on ELPC.

Here’s a quote from that page:

Earlier this year ELPC raised at least $137,500 from natural gas, renewables or financial companies that would benefit from ELPC’s efforts to kill nuclear plants. ELPC raised it at its dinner where “recognition from the podium” was given by groups like Invenergy, a natural gas and wind company, for investing $10,000 to $25,000 to ELPC.

"Everybody looks with excitement when a new natural gas plant is build," ELPC head, Howard Learner said when justifying his efforts to replace nuclear plants with fossil fuels.

And of course, we cannot forget the Sierra Club finally admitting it took $26 million from natural gas companies.  Time magazine has an excellent article about this.

Encouraging Pro-Nuclear Public Opinion

I stated the goal of the march as encouraging pro-nuclear public opinion.  In my view, this is the ultimate goal of pro-nuclear activism.

It almost doesn’t matter the official description of what is happening: a vote in a legislative body, a public service board hearing, a lawsuit, a referendum.  In all these cases, pro-nuclear public opinion will make a difference.

I remember when I was first starting out in pro-nuclear advocacy.  I wondered why local anti-nuclear groups were holding rallies outside a courthouse where a judge was deciding a legal case about nuclear energy.  A man who was much wiser than me explained: “Judges read the papers, too.” After that, I was quite willing to hold rallies outside of courthouses, right there with the anti-nuclear groups!

Exposing Opponent Ties to Fossil Fuels

One way to build pro-nuclear public opinion is to call the anti-nuclear groups exactly what they are: anti-nuclear groups.  Not “environmental” groups or any other green-washed words.  They are anti-nuclear lobbying groups, plain and simple.

Yes, of course, nuclear advocates have to present our positive vision of a world with abundant clean energy.  But we also need to show that our opponents are not honorable young Boy Scouts.  That’s how the opponents want to be seen.  

They aren’t Boy Scouts.  They are lobbyists.

To sway public opinion, we have to show their motivations, as well as our own.

-------
The organizing group

The Chicago event was organized by Environmental Progress and other groups of the Clean Power Coalition. Here’s a group picture from the meeting.   (I’m in the middle, in a pink turtleneck with a very visible necklace.)


Tuesday, June 21, 2016

Diablo Canyon and What To Do About It

Rally for Diablo Canyon
Mothers for Nuclear,, Californians for Green Nuclear Power and others
June 17, 2016
San Luis Obispo
Photo from Californians for Green Nuclear Power
The Announcement and What To Do

Today, PG&E announced that it would not apply for a license renewal for Diablo Canyon, but would close the plant by 2025. The New York Times article this morning: California's Last Nuclear Power Plant Could Close.

 IF this agreement goes through, Diablo Canyon will stay open for another eight years before it closes.  Eight years is not tomorrow. This is not the time to despair and scuttle the ship.  Now is the time to take action! There are things we can do to help our nuclear plants survive.

Right now, we can do two things:  Sign a Petition and Make a Donation. I have done both.

Sign a Petition to the White House

A petition to the White House requests that the special benefits of nuclear power be recognized by federal government policy. The petition has 13,000 signatures, and needs 100,000 to get a response from the White House.  Sign it here to Keep America's Nuclear Power Plants Working for US!

Please sign it and circulate it!

Make A Donation to the March for Environmental Hope

California pro-nuclear groups are marching from San Francisco and Oakland to Sacramento,  in the March for Environmental Hope.  They will publicize the importance of nuclear power for California, and they will attend a meeting of the California Lands Commission. The Commission will be holding a crucial vote about Diablo Canyon.

The March is sponsored by Mothers for Nuclear, Save Diablo Canyon, and Environmental Progress.  Other groups will be marching with them: Californians for Green Nuclear Power and Thorium Energy Alliance.  

The marchers in California are doing this for all of us, for everyone who believes in nuclear energy as the safe, clean energy of the future.  Help them!  You can donate here, and help pay campground fees and so forth for the marchers.

 Commentary

Three excellent articles, worth reading:

Rod Adams at Forbes: NRDC Announces PG&E Has Agreed to Kill Diablo Canyon
James Conca at Forbes: Pro-Nuclear March In San Francisco to Protest Closing of Diablo Canyon Nuclear Plant
Michael Shellenberger at Environmental Progress: Why Diablo Canyon Will Live--and Why the Corrupt PGE-IBEW-NRDC Proposal Will Fail

And, just for fun, to see some of the stakes in this particular case, from the San Diego Times Tribune yesterday: Heat wave raises worries about power outages. To quote the article:

Rotating outages result when utilities, largely due to gas issues, don't have enough supply to meet demand.
"We would tell the utilities to turn off the power to a substation...until.... we can go back to balancing supply and demand in real time," Greenlee (of California ISO) said.
Outages can last from 30 to 90 minutes.
But Greenlee said as of Monday afternoon, the system was holding up.

------
In other words:

Sign!
Donate!


Tuesday, March 29, 2016

Natural Gas Replaces Vermont Yankee Energy: Guest Post by Michael Bielawski

Natural gas replacing Vermont Yankee’s energy

This post appeared in Vermont Watchdog on March 29, and is used with permission.  

Activists rally outside the Statehouse following a vote by the Vermont Senate to retire the Vermont Yankee nuclear plant in 2012. Since the plant’s closing, energy derived from natural gas has increased more than 5 percent.

When Vermont Yankee closed at the end of 2014, it was largely with the understanding that renewable energy sources were going to take its place. According to data supplied by regional grid operator ISO New England, such has not been the case.

Over the past two years, about 5 percent of New England’s electric use swapped from nuclear to natural gas. While nuclear production dropped from 34 percent to 29.5 percent, natural gas rose from 43.1 percent to 48.6 percent. The data from ISO New England’s Daily Generation by Fuel Type 2014 and 2015 was analyzed by the Institute for Energy Research, a group that tracks government regulation of global energy markets.

Vermont Electric Cooperative CEO Christine Hallquist says the market is shifting towards natural gas.

“There’s a solid connection between the increased use of natural gas for generation in New England and the shutdown of Vermont Yankee,” she said. “There’s also been coal-fired generation that’s been shut down, and natural gas is replacing it. It’s the same trend all around the country.”

According to the U.S. Energy Information Agency for Vermont, in 2013 at least 9.7 trillion BTUs, or about 8 percent of all consumed energy, came from natural gas.

Going forward, natural gas production could be coming to Vermont in a big way. Last year, the Vernon Planning Commission held a public meeting verifying they’ve been in contact with a developer about building a $750 million gas plant in town. That facility would link up to a not-yet-approved Kinder Morgan gas pipeline planned for southern New England.

Hallquist said increased natural gas output is necessary because renewables can’t fill the gap left by Vermont Yankee’s exit.

“The contribution from solar and wind wouldn’t be significant enough to make up for the generation of Vermont Yankee,” Hallquist said. “In fact, there’s no way. … You would have to build like 1,800 megawatts of wind.”

According to Hallquist, wind and solar have “low capacity factors” because they are dependent on the weather. The capacity factor is the average power generated divided by its peak capacity.

If a 10-megawatt solar array averages output at 1.5 megawatts, its capacity factor is 15 percent. The capacity factor for wind is 30 percent. By comparison, gas and nuclear energy sources have a capacity factors of around 80 percent.

Opposition to Vermont Yankee gained momentum in 2010, when Gov. Peter Shumlin, then Senate president pro tempore, led an effort to prevent the Public Service Board from ruling on Vermont Yankee’s application to continue operation. While plant owner Louisiana-based Entergy already had federal approval to continue operation, the company decided to close Yankee, in part due to hostile political winds.

Hardwick Electric Manager Mike Sullivan said he remembers Shumlin saying Vermont could close Yankee because the state didn’t need the power.

“(The claim) from the governor and others was, ‘We don’t need it, we don’t need the power,’” Sullivan said. “Well, if we don’t need the power, why are we filling it up? Why are we building all these new transmission lines and doing all these other things if we didn’t need it?”

Sullivan said he didn’t support Yankee’s closing because it provided low-cost power.

“My beef is, Vermont Yankee said we’ll sell you our power, 600 megawatts or most of the state’s needs at peak, if not all then most of the time, for 4 cents a kilowatt hour,” he said. “Dirt cheap, and they basically told the utilities don’t buy their power, don’t sign an agreement, don’t mess with them, they are out of here.”

According to Sullivan, natural gas for heating takes priority during Vermont’s many cold spells. This causes the otherwise very cheap energy — around 4 cents per kilowatt hour — to spike.

Hallquist said the proposed Kinder Morgan pipeline would boost capacity during cold spells, when everyone uses gas for heat.

“(The pipeline) is to address the congestion issues,” he said. “Now, there are natural gas tankers and there’s oil set aside to deal with those congestion issues.”

Green Mountain Power spokesperson Dorothy Schnure said the Colchester-based utility’s power purchase contracts have been lengthy enough to be unaffected by the Yankee’s closure. However, Schnure and Sullivan both said that when their organizations buy market power, a portion of that is natural gas.

Beth Parent, communications manager for Vermont Gas Systems, says natural gas offers heating for over 50,000 families, businesses and institutions in Franklin and Chittenden Counties. She added that 14 percent of Vermont families and businesses use natural gas as a primary heating source.

Contact Michael Bielawski at mbielawski at watchdog.org
Sign-up for our Vermont Watchdog email list to receive the latest news and in-depth coverage.
----------
Michael Bielawski
A Seton Hall 2005 graduate, Michael has been writing freelance articles for various publications in and around New York City, Seoul in South Korea, upstate NY and Vermont for ten years. He currently is a staff writer at the Hardwick Gazette keeping track of rising school budgets and other rural Vermont issues. He likes best to write about health, economics, and geopolitics generally looking for angles not seen in mainstream media. At home he's very busy looking after two little boys and during free time loves to watch Stanley Kubrick films off Netflix.

--------
Note: This post has been updated with a correction. To replace Vermont Yankee, we would need to build 1,800 MW of wind, not 1,800,000 MW, as first printed.  (It's that old MW, KW thing again.)

Bielawski has other guest posts on this blog, most recently Grid Upgrades, Siting Rule Changes for Vermont, in February 2016

Two earlier posts at this blog described the replacement of Vermont Yankee power by natural gas power: Vermont Yankee Was Replaced by Natural Gas: Doing the Numbers, on January 2, and The Replacement for Vermont Yankee Was Natural Gas: Guest Post by Mike Twomey on January 7


Friday, February 12, 2016

Reality: Natural gas, not "could'a, would'a, should'a" renewables

Diablo Canyon
"We could'a used renewables"

Oddly, that is a cry that nobody is crying, as nuclear plants shut down and gas plants spring up in their absence.  When nuclear plants close, natural gas plants take their place.

On this blog, I tend to write about Vermont Yankee. (Not surprising.)

At Northwest Clean Energy blog, I generalized the Vermont Yankee experience of nuclear-to-natural gas by looking at the Western U.S.  My post is Reality: Less nuclear means more natural gas.   I described the replacement of nuclear-electricity by gas-electricity that  happened when San Onofre closed. I look at what would happen if Diablo Canyon or Columbia Generating Station closed.

Yeah, you can guess.  Nuclear power is (or would be) replaced by natural gas.  More carbon dioxide and more air pollution will enter the atmosphere.

The final paragraph of that post is: We need to keep Columbia Generating Station and all other sources of low-carbon power. Because if we don’t, despite should’a, would’a, could’a … our current low carbon power will be replaced by natural gas.

I hope you will read the post.


Monday, February 1, 2016

Nuclear Blogger Carnival 298, at Yes Vermont Yankee

Once again, we are proud to host the Carnival of Nuclear Energy Bloggers, right here at Yes Vermont Yankee. The Carnival is a compendium of nuclear blogs that rotates from blog site to blog site, and it is always a pleasure and an honor to host it.

Let's start with blog posts directly about nuclear energy.  Nuclear power is moving forward, world-wide, despite opposition.

Fukushima Updates--Leslie Corrice
Takahama unit #3  has restarted, and this has spurred  numerous FUD-based press reports. The main reason is the use of MOX fuel bundles in 15% of the core. The postings also focus on allegedly inadequate emergency planning, the lack of a national nuclear waste disposal option, the inference that the only benefit of nukes is making money, and citizens claiming a violation of their human rights.

Neutron Bytes - Dan Yurman
Leading developers and potential customers of small modular reactors (SMR) have formed a consortium, called SMR Smart, to advance the commercialization of the innovative light water reactor designs.
Also, developers of advanced nuclear reactors are pleased with their DC summit meeting held last week.

Next Big Future--Brian Wang

China plans on at least 110 Nuclear Reactors by 2030
Many will be 1400 MW or larger.  The Chinese supply chain is well in place.

Lightbridge is making progress on improved nuclear fuel
This fuel should increase energy production by 17% in existing reactors.

Bad air quality in Japan from lack of nuclear energy and air pollution in China
Hopefully, reactor restarts in Japan will ease the problem. But right now it is pretty bad, with 60% of monitoring sites in Japan above the particulate pollution standard. 

Neutron Bytes - Dan Yurman
French energy group EDF has postponed giving final approval for construction of the twin 1600 MW Areva EPRs in Somerset, UK. The current cost estimate, which is a work in progress, is pegged at between $18-20 billion.
The move to delay the final investment decision is said to have been made as a result of concerns within the French government and by investors about whether the financing was firmly in place for the huge project and whether costs could be contained over a decade long period of construction of the reactors.

Next:  Can renewables replace fossil fuel and nuclear?  Well, no. Here are some posts on that issue.

Forbes--James Conca
Exxon Believes That Global Use Of Oil And Gas Will Continue To Increase
The largest fossil fuel company in the world predicts our energy mix won’t change a whole lot over the next 25 years. In fact, Exxon Mobil projects that oil and gas will actually increase by 2040, even as coal decreases a bit. This unfortunate future stems from the age-old conundrum of trying not to eat sugar when your pockets are full of candy. The Earth has so much fossil fuel, and it has become so cheap to extract it, that it defies logic to think that humans will not keep burning it as their main source of energy.

Northwest Clean Energy--Meredith Angwin
Reality: Less nuclear means more natural gas
Vermont Yankee and San Onofre closed recently. Natural gas-fired plants took over and made the electricity that replaced the nuclear outputs.  Meanwhile, paper after paper, and study after study, trumpet the coming world of renewables.  These are just studies.  Though renewables maybe would'a, could'a, should'a replaced the closed plants, the reality is that less nuclear means more natural gas.

The National Oceanographic and Atmospheric Administration (NOAA) and the Cooperative Institute for Research in Environmental Sciences (CIRES) jointly published a paper about a new model they've created to simulate using weather-dependent energy sources to reduce greenhouse gas production from the US electricity sector. 
Their scenarios include generous amounts of natural gas, a nationwide HVDC transmission network,  and other conditions. Some news outlets have published headlines citing  the large reduction without noting the required conditions. Shocking, isn't it?

The Atomic Show (podcast)---Rod Adams
Freeman has been actively doubting the value of nuclear energy since the mid 1970s. He's now in his 90s. Leah Y Parks is a writer who earned an MS in environmental engineering and has some experience in developing water infrastructure projects. She, like Freeman, believes that wind, solar and water can do it all, even if all energy now supplied by burning fossil fuels is converted to electricity.  The conversation is civil, even though the participants have unresolvable disagreements. 

Yes Vermont Yankee--Guest Post
In this case, strong-arm tactics are being used to promote renewable use, whether people want it or not. Recently, the Vermont Attorney general's office announced that they were investigating Annette Smith for possibly "practicing law without a license." Ms. Smith is a prominent anti-wind advocate.  In this guest post, Vermont lawyer Deborah Bucknam explains that the preposterous charge will likely be thrown out. Nevertheless, the charge will  hamper free speech and encourage wind developers. 


Thursday, January 7, 2016

The Replacement for Vermont Yankee Was…Natural Gas: Mike Twomey Guest Post

The Replacement For Vermont Yankee Was . . . Natural Gas
By Mike Twomey

Several years ago, while the legal and public relations battle raged over the future of Vermont Yankee, anti-nuclear activists -- and some elected officials -- confidently predicted that, if the plant closed, its output would be replaced by wind, solar, and other renewable energy sources.   Pro-nuclear advocates expressed doubts about that future, arguing instead that the loss of a baseload nuclear plant would inevitably lead to greater reliance on fossil fuels.  Similar debates continue with respect to Pilgrim (Plymouth, MA), Indian Point (Buchanan, NY), and other nuclear facilities.

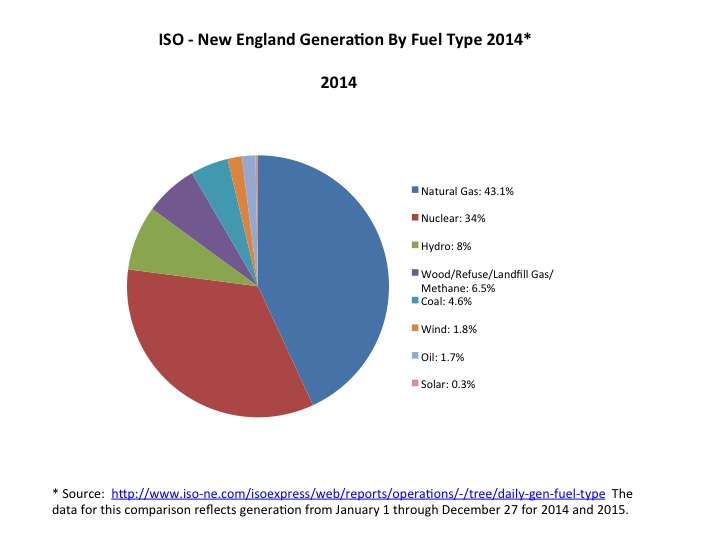
Now that 2015 has come to a close, we have an opportunity to evaluate the facts. ISO-New England (the non-profit, independent entity that ensures the reliability of the electric grid in New England) publishes data that shows daily generation by fuel type.  That data shows that in 2014 (the last year of Vermont Yankee's operation) natural gas-fired generators supplied 43.1% of the energy in New England, while nuclear provided 34%.   In 2015 (the first year since 1972 without Vermont Yankee) natural gas-fired generators supplied 48.6% of the energy in New England, while nuclear provided 29.5%.


Comparing these two charts shows the growth of natural gas on the grid
2014 and 2015
Blue is natural gas
Red is nuclear


As you can see in the chart below, the contribution of other sources of energy in New England remained essentially unchanged in 2015 compared to 2014 (the largest change was that coal-fired generators contributed one percent less in 2015 compared to 2014 (3.6% v. 4.6%).   The contribution of wind and solar remained vanishingly small in both years (wind was 2.4% in 2015 and 1.7% in 2014, while solar was 0.4% in 2015 and 0.3% in 2014).

Double-click to enlarge chart 

Generators in New England produced approximately the same amount of total MWhs in 2015 and 2014 (106.7 million MWhs in 2015 v. 107.2 million MWhs in 2014).  Taking into account the unusually mild weather in late fall of 2015, these figures deflate another prediction by anti-nuclear advocates that Vermont Yankee's baseload contribution could be replaced, in part, with energy efficiency.

The bottom line is that, without Vermont Yankee, nuclear's carbon-free contribution to the New England electric grid fell by 5.3 million MWhs in 2015 compared to 2014. Over that same time period, the contribution of natural gas-fired generators increased by nearly 5.7 million MWhs.   According to the U.S. Energy Information Agency, natural gas-fired generators produce 1.21 pounds of CO2 per kWh (https://www.eia.gov/tools/faqs/faq.cfm?id=74&t=11).  Using that formula, the additional MWhs of energy from natural gas-fired generators in New England in 2015 compared to 2014 equals approximately 3.1. million metric tons of additional CO2 in 2015 compared to 2014.  To put that in perspective, 3.1 million metric tons of CO2 is equivalent to adding more than 650,000 passenger vehicles to the roads in New England during 2015.

About this post:

This post first appeared in Linked-In on January 2, 2016 and is reprinted here with permission from Mike Twomey.  This post is a good companion piece to the recent post at this blog:  Vermont Yankee was replaced by natural gas: Doing the numbers.

The conclusions of the two posts are the same---because facts are facts.

The earlier Doing the Numbers was based on EIA data. This current post by Mike Twomey is based on ISO-NE (New England grid operator) data.   Mike Twomey's post includes data through the end of 2015, while the other post only includes data to the third quarter of 2015.

About the author:  

Mike Twomey is Vice President for External Affairs at Entergy. He is involved in many areas of negotiation and outreach concerning the nuclear plants. For example, Twomey was quoted in an October post at Vermont Digger: Entergy may move fuel into dry casks sooner than anticipated. In that article, he explains the financing of dry cask storage at Vermont Yankee.


Saturday, January 2, 2016

Vermont Yankee was replaced by natural gas: Doing the numbers

Vermont Yankee energy was replaced by natural gas.  That's the bottom line.

Three Quarters Compared

During the first three quarters of 2014, (January through September) Vermont Yankee was running.  During the first three quarters of of 2015, it had shut down.

Scott Luft writes the ColdAir blog, which is mostly concerned with Canadian energy issues. http://coldair.luftonline.net. However, in early December, Luft tweeted some comparisons of energy sources in the Northeastern U.S.,  before and after Vermont Yankee shut down.  Similar charts are below.

Changes in Fuel Usage: New England Grid
Comparison of first nine months 2015 to similar 2014
Comparison of first quarter 2015 to last quarter 2014

The rise of natural gas with the fall of nuclear

First look at the top chart--the nine-month comparisons.  About 1500 GWh more electricity was produced in the first nine months of 2015 than in the first nine months of 2014 (see the "all fuels" line).  Almost all of the change in electricity (top chart) was produced by an expansion of the use of natural gas, making up for the drop in nuclear and coal. There was also an expansion of utility-scale photovoltaic energy, but the vast majority of the change in power supply was expanded use of natural gas.

One anti-nuclear commentator challenged these results, saying that looking at the first three quarters was a clever way to cherry pick data and avoid the true story of what really happened. Nuclear and natural gas use both fell between the last quarter of 2014 and the first quarter of 2015.

And indeed, they both did (second chart).

This wasn't anything to be proud of, however.  The first quarter of the year is quite cold in the Northeast, and people use natural gas to heat their homes.  Therefore, many natural gas-fired power plants cannot obtain fuel.  Oil and coal take up the slack.  Nowadays, natural gas plants are equipping themselves to be dual-fired, so they can burn oil.

Nuclear went down, natural gas wasn't available, and oil and coal use went up.  Nothing to celebrate. We're not looking at "green" energy expanding.

You can double-click to expand the charts.
------

History of the charts

After I saw Luft's tweet, I contacted Scott Luft and asked him about his sources. Luft very kindly re-produced his sources and spreadsheets.  Luft's information came from several queries to the EIA data browser.

Luft had pulled the information into spreadsheets. Later, my husband George pulled the same data into the Macintosh spreadsheet that he likes better. Then he made the charts from the data.  The data from his spreadsheets is shown below.  It is all based on queries to this EIA database.

Deepest appreciation to Scott Luft and George Angwin.


History of the anti-nuclear comments

Also, Scott Luft compiled a "storify" of his twitter interchange with Mark Z. Jacobson on this subject.    In my opinion, Jacobson comes off badly in the exchange. It doesn't take complex work to show the flaws in Jacobson's arguments.  You simply start with quoting him directly, and the facts take it from there.


Sunday, October 25, 2015

Carbon taxes and the Fitzpatrick plant: a reason to sign the petition

The petition

There's a petition to save the Fitzpatrick plant.  The petition is addressed to Entergy.  I think it should be addressed to Governor Cuomo, as you can tell by my post on Governor Cuomo, Fitzpatrick and Money.  At any rate, I signed the petition.

http://www.savefitzpatrick.com

I encourage you to sign the petition to show support of Fitzpatrick.  More signatures will be a good thing, wherever the petition is addressed.

Carbon dioxide taxes?

Some of the people who signed the petition also left comments.  I was particularly struck by a comment that noted that many states are considering carbon taxes.  If carbon is taxed, that will increase people's electricity bills. If Fitzpatrick is not running, and most of its power is made by natural gas plants, there will be an increase in people's electricity bills.

I decided to do a quick and dirty calculation of the amount of money Fitzpatrick will save New Yorkers…if there is a carbon tax.  Here's my calculation, and my sources.  I invite comments and corrections.

Fitzpatrick and carbon taxes:

How much energy: 
Fitzpatrick makes 838 MW of dependable capability. Source, Entergy Nuclear.
There are 8760 hours in a year.
I assumed a 90% capacity factor, which is on the low side for the nuclear fleet.
At that point, we have 838 MW x 1000 kW per MW x 8760 hours per year x 0.9 hours operating per year, and we have

Fitzpatrick produces 6,606,792,000 kWh in a year of operation.

Saving how much carbon:
Okay, now, what if that power was produced by a gas-fired plant?

Gas plants make, on average, 1.21 lbs of carbon dioxide per kWh. Source: EIA

This number is an average for gas-fired plants, and no doubt someone will come up with a lower number, with the assumption that only bright shiny new combined cycle plants should be counted.  Since these shiny new plants would still only be part of the local fleet of gas plants, I will stick with my number.
carbon dioxide

So, now we have 7,994,218,000 lbs of carbon dioxide being produced if Fitzpatrick nuclear station is replaced by gas plants.  And now, a brief pause to realize that that Fitzpatrick save 7 billion pounds of carbon dioxide per year.

Next, let's look at money.

In terms of carbon taxes:
Carbon taxes. This is where it gets a little tricky. There are plenty of carbon tax bills introduced, often for as much as $40 per ton.  However, that feels a little theoretical for me.  I can't find a place where a carbon tax is really that high.

So I went to a website that compares carbon taxes, world-wide, and came to the conclusion that $20/ton, as in British Columbia, was a number that I was more comfortable with using.

 7,994,218,000 lbs of carbon dioxide x 1 ton/2000 lbs is 3,997,109 tons of carbon dioxide.

At $20/per ton, this would be $79,942,183 dollars paid in carbon taxes, by the citizens of New York, to support the natural gas power that would replace Fitzpatrick.

Call to Action!

Assuming only modest carbon tax is introduced, a tax at half the number ($40/ton) that is often bandied about, continued operation of Fitzpatrick will save the ratepayers of New York, about $80 million a year in carbon taxes. If the big number ($40/ton) is used, Fitzpatrick will save ratepayers $160 million a year in carbon taxes.

In short, if the state of New York is serious about reducing carbon dioxide and saving money for all ratepayers, a modest amount of support to Fitzpatrick is in the interest of everyone in the state.

(And that doesn't even count the well-known volatility of natural gas prices. Natural gas won't be cheap forever.)

So, your action is simple:

Sign the petition! 

And, if you live in New York, contact your state legislator and your congressman.


Sunday, August 9, 2015

The Pain of Closing Vermont Yankee: Post at Northwest Clean Energy


Pain from Closing Vermont Yankee Lingers was published Friday at Northwest Clean Energy, the blog of Energy Northwest.    Seven months after Vermont Yankee closed, I wrote this retrospective on "what has happened since."

This is what has happened after Vermont Yankee closed:

  • more pollution
  • more pain on the grid (gas-fired plants are being built as rapidly as possible)
  • major economic pain for employees and for the area.

I went back to some of my 2010 posts, the ones where Governor Shumlin was predicting a "jobs bonanza" when the plant closed. I wrote about the Seabrook contracts today.  I wrote about the economic analyses done in 2010 and 2011, about how many jobs would be lost and how the economy would suffer. I wrote about what is happening now, and how today's situation was completely predictable.

Pain from Closing Vermont Yankee Lingers was a hard post to write.  It has extensive references and will be helpful to anyone who wants to get "the story" of Vermont Yankee.

I encourage you to read it and to comment.

Tuesday, February 10, 2015

Why Electricity Costs Spiked in New England: My Op-ed

Why Are the Rates Rising?

A Valley News "Forum" letter writer was speaking for many recently when he asked about the huge electric rate increases this winter and the paltry explanations for them. David C. Montgomery of Hanover said his electricity bill had increased by 72 percent, even as petroleum products have dropped in cost. “All we have seen,’’ he wrote, “is a rather unconvincing claim about the need for more natural gas pipelines in New England and a series of what seem to be diversionary workshops on insulation.”

His letter states the problem succinctly. Oil prices are down. Gasoline prices are down to levels not seen for years. Natural gas prices are still low. “The need for more pipelines” does seem a rather weak claim, compared to the cheapness of the commodity carried in them. Also, why would we need more pipelines now, when we didn’t need them five years ago? The demand hasn’t changed that much.

The answer is that the grid itself has changed in our region. Power plants have been retired: Salem, Mt. Tom, Vermont Yankee. When coal and nuclear plants shut down, existing gas plants run longer and use more fuel, to make up for that power. More gas-fired plants are also being planned for the future.

More Gas Needed

Around 2000, about 15 percent of New England’s electricity was made by burning natural gas. Gas was expensive, and used only during times of peak demand. The rest of the time, electricity was supplied by a mixture of coal, nuclear, oil and hydro. Back then, with only 15 percent of electricity coming from natural gas, pipelines to the Northeast were adequate.

Now, the price of natural gas has fallen, and nearly half of our electricity demand is met with the newly inexpensive natural gas. With increased demand, the pipelines are no longer adequate. Particularly during very cold weather, when homes use more natural gas for heating, there isn’t enough available for power plants.

Last year, when temperatures plummeted and natural gas ran short, power plants burned oil, diesel and even jet fuel. The price on the grid went up as utilities bought power produced with more-expensive fuels. Last year, bulk electricity prices often soared past 40 cents per kWh (kilowatt hour) during times of high demand. (It’s usually 3 to 8 cents per kWh.) You can track realtime prices on the grid operator site (ISO-NE) on the Web.

Other costs also go up when power plants retire, but these aren’t so easy to track. For example, capacity payments go up. So far, I have described prices for kWh . . . that is, for power produced. There’s also something called a “capacity payment”: a payment for a plant to be available to produce power. The capacity payment auction takes place three years in advance. In 2013, the auction yielded $1 billion for power plant operators. Then a number of plants retired. With more scarcity, the 2014 auction brought $3 billion to plant operators. These billions are not as visible as the “price on the grid,” but the money comes from ratepayers and raises everyone’s cost of electricity.

Montreal Snow
from Wikipedia
Winter Reliability

Then there’s the reliability issue. The grid operator will do whatever it must to ensure reliability. For the past two winters, our grid operator has run “winter reliability programs” and frankly, that program saved us last winter. Last winter, the operator paid about $70 million to power plants that could burn oil. The plants used this money to stock up — with a supply on site, they had fuel available when they were called upon. Indeed, when gas-fired plants could not get gas, the oil-burning plants went online.

Last year, the Winter Reliability Program cost $70 million in the Northeast. This year, it is budgeted at $80 million. These multimillion dollar programs get translated into our winter power bills and winter price rises. However, there is a bit of hope for the future. This has been a milder winter, with low oil prices. To date, the grid’s Winter Reliability Program has spent far less than last winter, and that is a hopeful sign for the future.

Renewables

What about renewables? I will not focus much on renewables or their costs, because they are a very small portion of the electricity supply. I have been watching the hourly fuel supply on the grid rather closely, and wind has never been more than 2 percent of the supply. Renewables, including biomass and refuse, are about 6 percent of the supply. Renewables are not the cost-drivers on the grid.

Solutions, Maybe

I’ve explained the reasons for recent price rises, but do I have a solution? Well, a partial solution, maybe. First, I believe in conservation, and I just invested a great deal in improved insulation for my house. (And I want to thank Efficiency Vermont for picking up part of the cost.) To me, workshops on insulation are not merely diversionary. They are terribly important.

Being in favor of insulation is about as controversial as favoring real maple syrup. My second point is a little more controversial. Supposedly, we need more pipelines because gas is the fuel of choice . . . now. It’s abundant and cheap. But I don’t think it will remain cheap. Should we be building more pipelines because of low-priced gas? I am not sure. If the price of gas goes up, the pipelines will not be fully used.

Pipeline Pig Launcher
Wikipedia
Instead of more pipelines, I think we need a diversified grid. If we choose, we can build more renewables with a diversified grid, just as we can build them with a mostly-gas grid. And with a diversified grid (yes, I mean keeping our nuclear, coal, oil, Hydro-Quebec power as well as gas), we won’t have all our eggs in one basket.

If we are going to have a heavily natural-gas grid, we could keep our costs more stable (for now) and our grid more reliable by building more gas pipelines. But I think it would be better to choose conservation and grid diversity. With that, perhaps we could have reliability and prevent further drastic price rises in the future.

-----
Meredith Angwin of Wilder is a physical chemist who worked for electric utilities for more than 25 years and now heads the Energy Education Project of the Ethan Allen Institute.

-------------
This op-ed appeared in the Valley News Sunday, January 18, 2015. I have edited it slightly (such as explaining that "Forum" is the Valley News letters section.)

It was illustrated with a very nice picture of Vermont Yankee.  The op-ed has appeared other places, also, including Vermont Digger, where it began to have a lively comment stream, but then a well-known anti-nuclear activist took over the comments.

I don't think it is worth duking it out with trolls, especially after they insult me.  For example, this line: Ms. Angwin still fails to acknowledge, however, that her basic premise is simply false: it is simply not a “fact that electricity prices are soaring all over the region.”  

In cheerier news about this op-ed, Don Kreis wrote a letter to the Valley News about my op-ed. Kreis is a former professor at Vermont Law School and a hearing officer with the Vermont Public Service Board. (His letter is not on the web, so I can't link to it.)  I am proud to quote the first sentence of Kreis's letter:

Meredith Angwin of the Ethan Allen Institute is a rock star among energy analysts, and she hits the right chord by blaming the recent run-up in electric rates on our big regional embrace of natural gas as a generation fuel.